
The Determinants of Service Quality in the Hospitality Industry Sector of Botswana
Wilbert Kudakwashe Chidaushe*  , Stegi Shine and Mini Sebastian
1Department of Accounting and Finance, Botho University, Gaborone, Botswana .
wilbert.chidaushe@bothouniversity.ac.bw
http://dx.doi.org/10.12944/JBSFM.07.02.05
The study examined the determinants of service quality in motels and hotels in Botswana. The study administered 800 questionnaires distributed to hotel staff and prospective hotel guests of selected hotels and motels operating in Gaborone. Random sampling was used for the study. The quantitative data was subjected to confirmatory factor analysis through using AMOS to run Structural Equation Modelling (SEM). A new model Structural Equation Modelling A was developed that balanced theory and data used in the study. The results of the study revealed that hotel service quality is significantly and positively correlated with assurance, responsiveness and the tangibles. There was also a significant and negative relationship between hotel service quality and empathy and reliability. The study recommends hospitality managers around the country of Botswana to channel resources towards appealing hotel artefacts, as well as providing reasonable assurance and availing reliable timeous responsiveness to customer complaints. In addition, hotels around the country should provide environmentally sustainable services and policy makers must oversee that this is implemented for the benefit of the community.
Copy the following to cite this article:
Chidaushe W. K, Shine S, Sebastian M. âThe Determinants of Service Quality in the Hospitality Industry Sector of Botswanaâ. Journal of Business Strategy Finance and Management, 7(2).
DOI:http://dx.doi.org/10.12944/JBSFM.07.02.05Copy the following to cite this URL:
Chidaushe W. K, Shine S, Sebastian M. âThe Determinants of Service Quality in the Hospitality Industry Sector of Botswanaâ. Journal of Business Strategy Finance and Management, 7(2).
Download article (pdf) Citation Manager Publish History


Introduction
The study explored the determinants of service quality in the hospitality industry in Botswana. The study focused on commercial hotels and motels contained in the hospitality industry of Botswana, in Gaborone. In accordance with the Tourism development master plan of 2000 the hospitality sector contributes approximately 43% towards the GDP of Botswana. The Hospitality industry has been defined as a service sector that focuses on the facilitation of food beverages and accommodation facilities for economic prosperity (Lashely & Morrison, 2000). Abdullah et.al (2022) deduced that restaurant appearances have durable auspicious influence on interactive purposes. Botswana Communications and Regulatory Authority (BOCRA) (2014) alluded to the importance of availing internet connectivity to the hospitality industry for providing assurance to guests on their access to online internet services. The following are the models that are deployed in the determination of hotel service quality
Models of hotel service quality
Several models had been inverted that are prescriptive in measuring the determinants of service quality including the SERVQUAL, SERVPERF and Kano's model among others. Parasuraman et al. (1988) inverted the SERVQUAL model. Cronin and Taylor (1992) developed the SERVPERF model. Kano's model was developed in the 1980s. The service quality dimensions used in these models are briefly described below.
SERVQUAL model
This model, widely used in hospitality, assesses the gap between guest expectations and perceptions of service quality. It uses a questionnaire with 22 items to measure the gap across five dimensions:
Service quality dimensions applied in the SERVQUAL
The following are the five service quality dimensions used in the SERVQUAL.
Reliability: The ability to perform the promised service dependably and accurately.
Responsiveness: The willingness to help guests and provide prompt service.
Assurance: The knowledge and courtesy of employees and their ability to inspire trust and confidence.
Empathy: The caring, individualized attention provided to guests.
Tangibles: The appearance of physical facilities, equipment, and personnel.
SERVPERF model
SERVPERF emphasizes how well the service provider performs, not the gap between expectations and perceptions.
Simplified Measurement
Service quality dimensions applied in SERVPERF model
The model uses the same five dimensions as SERVQUAL as mentioned earlier that include reliability, responsiveness, assurance, empathy and the tangibles. However, it directly assesses customer perceptions of service delivery, without the need to measure expectations.
Kano's Model
This model helps understand how different hotel attributes (e.g., room cleanliness, staff friendliness) contribute to overall customer satisfaction.
Service quality dimensions applied in kano's model
Attractive: These attributes, if present, can significantly enhance guest satisfaction.
Must-be: These are basic expectations that, if absent, can lead to dissatisfaction.
One-dimensional: These attributes have a positive or negative impact on satisfaction depending on whether they are above or below the expected level.
Statement of the problem
Provision of excellent service in the hospitality sector of Botswana remains an extreme challenge that is worthy to be addressed as the tourism and the hospitality sector of Botswana is a major contributor to the GDP of the country. Musikavanhu (2017) highlighted problems of poor service delivery in the hospitality industry of Botswana.
Musikavanhu (2017) highlighted problems of poor service delivery in the hospitality industry of Botswana. In accordance with the Botswana Tourism Board needs assessment report of 2009, it was revealed that employees of most hotels in the hospitality industry had the following attributes, poor skills, poor attitudes to customers, very minimum basic education, and poor work ethics. Further. in Botswana, the facilitation of service quality to the satisfaction of international customersâ needs significant reforms. Therefore, this study Examined the determinants of service quality in the hospitality industry in Botswana.
Research questions
The research questions for the study were: what are the determinants of service quality in the hospitality industry in Botswana? what are dimensions of service quality expected and perceived by hotel & motels in Botswana?
Objectives of the study
The objectives of the study were: to explore the determinants of service quality in the hospitality industry in Botswana: to investigate the dimensions of service quality that are expected and perceived by hotel and motels senior managers in Gaborone.
The conceptual research hypotheses
The null hypothesis for the research was:
H0: Hotel service quality is not significantly and positively correlated to specific service characteristics.
The alternative hypothesis was:
H1: Hotel service quality is significantly and positively correlated to specific service characteristics.
The following operational hypotheses for the study were tested in Botswana:
H1a: Hotel service quality is significantly and positively associated with the hotel service quality dimension of tangibles.
H1b: Hotel service quality is profoundly and positively correlated with hotel service quality dimension of reliability.
H1c: Hotel service quality is significantly and positively associated with hotel service quality dimension of responsiveness.
H1d: Hotel service quality is significantly and positively correlated with hotel service quality dimension of empathy.
H1e: Hotel service quality is significantly and positively correlated with hotel service quality dimension of assurance.
Materials and Methods
Literature Review
The determination of hotel service quality
Kumar (2024) observed that diminished service quality is linked to decline in customer loyalty. The study further revealed that the five dimensions of service quality have varying degrees of impact on customer satisfaction. The study was based on an empirical analysis of literature.
Motshegwa and Oshamo (2024) asserted that the Botswana hospitality business faces several obstacles in keeping information, such as a lack of trust, knowledge hoarding, and difficulty using the knowledge due to drawn-out requisition procedures. According to the report, Botswana's hotel industry would undoubtedly suffer from a lack of knowledge retention, which would lower the quality of services provided. Descriptive survey research design served as the foundation for the investigation. Staff members of hospitality organizations and the tourism business were given questionnaires, which served as the basis for the study.
Adetola and Adeosun (2024) identified hotel's accessibility, dependability, cleanliness, and friendly personnel as the critical elements that guests took into account. The study also showed that guests were extremely happy with the hotels' security and safety measures. Furthermore, the research revealed a strong and adverse correlation between customer satisfaction with the services provided and factors such as marital status, income, and place of residence. Furthermore, a strong and favorable correlation between religion and hotel service satisfaction was established. 270 people from Owo and Akure in Ondo State, Southwest Nigeria, served as the study's sample. Pearson's correlation and descriptive statistics were used for the analysis.
Perdomo-Verdecia et al. (2024) observed that the primary factor influencing customer satisfaction in hotel service arrangements is the quality of the food served in specialty restaurants. Furthermore, it was noted that the quality of the cuisine at specialty restaurants outweighed other considerations such buffet food quality and cleanliness of the room. Additionally, because cleaning and restaurant services are directly related to customer happiness, the study recommended that hotel management focus especially on their unpredictability. In order to analyze the data, the study used a case study using the Fusi set Qualitative Comparative Analysis (fsQCA). 30759 clients served as the basis for the research's sample size.
Asgeirsson et al. (2024) revealed that performance, reputation, performed service, and tangible service all exhibited a statistically favorable relationship with performance variability. The study used data from Icelandic hotel visitors and quantitative research methods. A sample of 1487 people from 9 hotels in the Icelandic network served as the basis for the study.
Chatibura (2023) identified key hotel attributes applied in the pricing of hotel room rates in Botswana that included the presence of fitness centre, conference and meeting facilities. The study covered 80 standard rooms in Gaborone. The research methodology for the study was dependent upon quartile regression based on hedonic pricing analysis. The study revealed that the presence of the aforesaid artefacts was significantly and positively correlated with hotel service quality manifested in the prices of the hotel room rates.
Chiguvi and Gabasiane (2023)âs study revealed several factors affecting the tourism sector that included, lack of skilled staff, lack of requisite infrastructure and inconsistent supply of quality goods among other challenges. The study was based on qualitative research facilitated by a thematic content analysis. The sample size of the study was 10 participants drawn from different sectors of the tourism industry.
Hammanjoda et al. (2023) affirmed that hotel guests placed a high priority on service quality, and their impression of service quality was influenced by tangibles, staff competency, responsiveness, empathy, and reliability. The survey also found that providing individualized services to consumers and resolving their problems increased guest satisfaction. Convenience sampling was utilized to attract guests to the study, which was based on a sample size of 413 hotel patrons. Regression analysis and descriptive statistics were both used in the study's data analysis.
Tangibility, dependability, empathy, responsiveness, and assurance were emphasized by Sulemana et al. (2023) as important predictors and determinants of consumer satisfaction and hotel patronage. Additionally, it was determined that both customer loyalty and hotel service quality are mediated by customer satisfaction. Three hundred respondents from various hotels in Tamale, Ghana, were given standardized questionnaires to complete as the basis for the study. SPSS was used to analyze the data gathered for the investigation.
Gajic et al. (2023) found that both tangible and intangible elements affect patronage among Mount Zlatibor hotel guests. Multi-regression analysis and quantitative research served as the study's foundation. Three elements covered loyalty factors, seven factors linked to non-material factors, and ten items defined material factors.
Three hotels in Zlatiborâhotel Mona (228 questions), Olymp (106 questionnaires), and Tornik (206 questionnaires)âprovided a sample of 540 respondents for the study. SPSS was used to analyze the data.
Phiphopaekasit and Anunthawichak (2022) confirmed that customer happiness is significantly influenced by customer loyalty, perceived value, business image, and customer expectations. A sample of 500 respondents served as the basis for the quantitative analysis. Stratified sampling was employed in the study to choose study participants.
Matenge (2021) proclaimed shortages of skilled chefs and cooks, lack of suitable kitchen equipment, long working hours and lack of ingredients were noted as the major challenges hindering the provision of quality services in the hospitality industry in Botswana the study was based on a survey of 150 customers from a mining canteen community.
Three kinds of factors, including management systems, social systems, and individual traits, were identified by Wu et al. (2021) as predictors of hotel internal service quality. Compensation, training, and process management were all part of the management system. The social systems prioritized collaborative culture, interdepartmental communication, and servant leadership. Collegial relationships, role stress, and sympathetic personalities are all part of the personal traits. The exploratory sequential mixed approach served as the foundation for the study. The study was divided into two sections. In study 1, 86 hotel staff members participated in 12 focus group interviews. 332 pairs of questionnaires were given to supervisors and employees as part of the quantitative study used in Study 2.
Meshack and Prusty (2021) showed a strong and favorable correlation between responsiveness as a service feature and customer loyalty and satisfaction. Furthermore, the study found no significant correlation between reliability and customer loyalty or customer service satisfaction. A sample of 205 visitors staying in hotels and guest homes in Tanzania's northern area served as the basis for the study. The partial least squares method was used in the study to analyze the data.
Garg et al. (2020) observed that the tangible aspects of accessibility, comfort and cleanness played a significant part in influencing perception of service quality in hotels in India. The intangible characteristics of responsiveness and empathy were noted as the most significant contributors towards hotel service quality (ibid). The study was based on the analysis of secondary data.
Bhuian (2020) acclaimed a close correlation between hotel service quality and the five quality dimensions and customer satisfaction. The study was based on qualitative descriptive research based on a sample of 80 open ended questionnaires that were distributed at a hotel in Sweden.
Li et al. (2020) found that whether hotel patrons are domestic or foreign visitors, their expectations of the quality of hotel services vary depending on their country of origin. According to the survey, in order to lower customer discontent among both domestic and foreign guests, luxury hotels should consider cleanliness, room, location, service, and value as vital features. Furthermore, it was found that the most important element that satisfied domestic hotel visitors was the quality of the accommodation, which was followed by value and service. The study also showed that hotel service was the most important element that satisfied foreign visitors, followed by room and price. Using a positivist approach, the study evaluated the three-factor hypothesisâbasic, performance, and excitementâon how well hotel service was perceived by patrons. 412784 user-generated evaluations for various Chinese cities were taken from Tripadvisor and used as the basis for the study.
Nkwede et al. (2022) stressed that value, security, and staff service quality all affect how satisfied customers are in the hospitality sector. The study's foundation was quantitative research that involved evaluating hypotheses. The survey that was administered to 317 Abakaliki hotel service customers provided the data for the study.
Nyagadza et al. (2022) hypothesized that hotel patrons' behavioral and attitude loyalty is directly impacted by total service quality, satisfaction, trust, value, and commitment. Structural equation modeling was used in this quantitative analysis. Stratified random selection was utilized to choose study participants from a prospective population of 600 people that was split up into strata. Additionally, the study used a web-based cross-sectional survey; the sample size was determined by distributing 234 questionnaires to hotel guests in Harare, Mashonaland East region, Zimbabwe, using the Web-based survey method.
In the one-star and two-star lodging categories, Nunkoo et al. (2019) found that personnel knowledge and the infrastructure of the accommodations were important indicators of consumer satisfaction. In addition, it was found that the two main factors influencing hotel service satisfaction in the three-star lodging facilities were safety and security and room quality. In four- and five-star hotels, waiting times and interactions with guests were shown to be the main factors influencing guest satisfaction. PLS-SEM was used to analyze the data in this quantitative investigation.
Sadick (2020) found that friendliness, hotel ambience, staff emotional stability, and responsiveness to client demands all had a major impact on customer satisfaction. Furthermore, the study found that direct staff services and room quality had a greater impact on guest satisfaction in Ghanaian hotels than did the external surroundings. The study's quantitative methodology was derived from a cross-sectional survey. The five hotels in Tamal were chosen for the study using purposive selection. Additionally, convenience sampling was used to choose the 200 study participants.
Singh and Kumar (2020) espoused that the main factors influencing hotel service satisfaction were room service, delivery time, hotel staff conduct, a pleasant welcome upon arrival, and the selection of meals and drinks. The study's sample consisted of 50 respondents who were surveyed in Iraq's Kurdistan region. SPSS was used to analyze the data.
Kiran and Kumar (2019) stressed that in four tourist destinationsâPalash Residency Bhopal, Shipra Residency Ujjain, Hotel Payal Khajuraho, and Betwa Retreat Orchha in Madhya Pradesh, Indiaâcustomers viewed empathy and tangibles as the most crucial elements that contributed to their level of satisfaction. A sample of 400 respondents who were given standardized questionnaires served as the basis for this quantitative investigation. Smart PLS 3 was used to analyze the obtained data.
Yang and Campos (2019) identified the two main elements that significantly and favorably impact hotel patron satisfaction are service capacity and service attitude. Breakfast and hotel amenities were shown to have no discernible positive impact on patron satisfaction. Customer satisfaction at hotels was found to be marginally impacted negatively by service efficiency. 1500 internet comments from one international hotel in Chenzhou City, Hunan Province, China, served as the basis for the study. Multilinear regression analysis was used in the study to analyze the data.
Mhlanga (2018) deduced that error free served order was the most important expectation in the provision of restaurant service quality. Clean dining area was identified as the most important perception regarding restaurant service quality. Service in the promised time reflected a significant and positive relationship with restaurant service quality. The study was based on empirical and non-empirical research. The sample size of the study was based on 253 customers and convenience sampling was used for the study.
Musikavanhu (2017) acclaimed that the main determinants of hotel service quality were providing assurance to the customer regarding exactly when the service will be performed, helpfulness to customers, clean furniture, serving food at the right temperature and correct billing and smiling at customers. The study was conducted through a customer survey based on a sample of 245 comprising of 52 restaurant employees, 55 restaurant managers and 138 restaurant customers in Botswana. The study was analysed using simple descriptive statistics and thematic analysis.
Fidzai and Caughey (2014) affirmed that the luxuriousness and elegance of a hotel depended on the appearance of architectural finish, furniture and accessories in the hotel lobby contributed to the extended inferences about the quality of service and cost of rooms in the hotel. In the study participants were more favourably impressed by hotels that had a home like look than those that appeared like business look. The study was based on qualitative research based on selection of cues by hotel customers. Fifty-one participants for the study were drawn from a community at university in western United States of America (ibid).
Fredericks (2023) proclaimed that hotels and motels services should offer a plethora of green initiatives through transformation to ecofriendly hotels and consider solar power installations, sustainable furnished rooms, sustainable food beverage menus, smart showers, reduction and cycling of wastes.
Methodology
The methodology of the study was based on quantitative research involving testing of the hypothesis. The study applied the service quality dimension of SERVQUAL in testing the posited hypothesis (Parasuraman et al., 1988). Shank and Brown (2007) and Cohen et.al (2011) observed that the contents, trends, and sampling of quantitative research can represent society at large. Furthermore, it is emphasized that the researcher must use precise objectives and criteria in quantitative research rather than making educated guesses (Lichtman, 2013). According to Denscombe (1998), quantitative research is a "researcher detachment" technique that preserves the researcher's objectivity. According to Christensen and Johnson (2020), Creswell (2009), Denscombe (1998), and Bryman (2012), quantitative research is defined by pre-established variables, hypotheses, and design. Conversely, it was also thought that one of the weaknesses of quantitative research was the researcher's disengagement from the participants (Daniel, 2016).
Christensen and Johnson (2020) also emphasized that the researcher's lack of appreciation for the participants and understanding of the group or person taking part in the study can result in bias (Shank & Brown, 2007 and Berg, 2007). Because the main advantage of a quantitative research technique is replicability, which is based on testing the hypothesis, this study selected a quantitative research approach despite its limitations.
Structural Equation Modelling (SEM) was applied to the data set obtained measuring the determinants of service quality in the hospitality industry in Botswana. Hoyle (2015) acclaimed that structural equation modelling, or SEM, is a collection of analytical methods used to simulate the relationships between data points. By broadly illustrating the relationship between the latent and observable variables, Schumacher & Lomax (2016) emphasized that SEM tests the researcher's theoretical models and the study's hypotheses. Using constructs that describe latent variables, Blunch (2013) concluded that SEM is helpful for measuring them. In order to investigate the hypotheses regarding the relationship between hotel service quality and hotel quality characteristics, the current study employed SEM.
The following regression equation was used for the study.
Equation 1: Determinants of Service Quality
![]()
Where:
B = regression coefficients associated with variables that determine hotel service quality
B0 = hotel service quality constant factor.
vit = error term
Presentation and Discussion of Research Findings
A hotel service quality survey consisting of 800 questionnaires was administered in hotels around Gaborone in Botswana. The proposed hypothesis of the study was tested through AMOS by running Structural Equation Modelling (SEM). Prior to running SEM on the data reliability analysis and confirmatory factor analysis was applied on the data through computation of Cronbach alpha and Kaiser Meyers Olkinâs (KMO) test. The Structural Equation Model A was then developed that balance theory with the data that was used for the study, as shown below in figure 1.
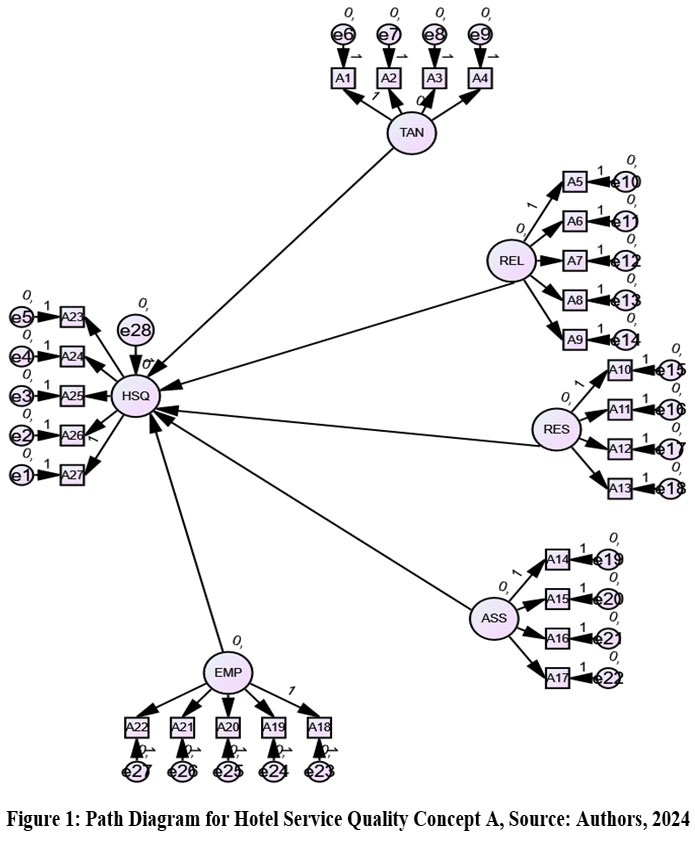 | Figure 1: Path Diagram for Hotel Service Quality Concept A, Source: Authors, 2024
|
Results
Results for demographic analysis for the study
25% of the participants who took part in the study were males and 75% were females as shown in table 1 below. 40% of the participants that took part in the study were concentrated within the 21-23 age groups. 40% of the participants were evenly spread among the 27-29, 30-35, 36-40 and 41-45 age groups. 10% of the participants were also equal spread around the 46-50 and in the 51 and above age groups.5% of participants were drawn from the 18-20 age group and another 5% were from the 24-26 age group as shown in table 2 below.
In addition, 50% of participants had a bachelor's degree, 25% had a diploma, 15% had a masterâs degree, 5% had a certificate and 5% were below certificate level. 35% of the participants had 3years and more of experience whilst 40% had 1-2 yearsâ experience in the hotel industry as shown in table 3 below. The remainder of the participants of 25% had less experience of less than 1 year in the hotel industry as shown in table 4 below.
Table 1: Gender
Freq. | % | % valid | Cumulative % | ||
Valid | Male | 200 | 25.0 | 25.0 | 25.0 |
Female | 600 | 74.9 | 75.0 | 100.0 | |
Sum | 800 | 99.9 | 100.0 | ||
Missing | System | 1 | 0.1 | ||
Total | 801 | 100.0 |
Source: Authors
Table 2: Age
Freq. | % | % valid | Cumulative % | ||
Valid | 18-20 years | 40 | 5.0 | 5.0 | 5.0 |
21-23 years | 320 | 40.0 | 40.0 | 45.0 | |
24-26 years | 40 | 5.0 | 5.0 | 50.0 | |
27-29 years | 80 | 10.0 | 10.0 | 60.0 | |
30-35 years | 80 | 10.0 | 10.0 | 70.0 | |
36-40 years | 80 | 10.0 | 10.0 | 80.0 | |
41-45 years | 80 | 10.0 | 10.0 | 90.0 | |
46-50 years | 40 | 5.0 | 5.0 | 95.0 | |
51 and above | 40 | 5.0 | 5.0 | 100.0 | |
Total | 800 | 99.9 | 100.0 | ||
Missing | System | 1 | 0.1 | ||
Total | 801 | 100.0 |
Source: Authors
Table 3: Education
Freq. | % | % valid | Cumulative % | ||
Valid | Masters | 120 | 15.0 | 15.0 | 15.0 |
Bachelor | 400 | 49.9 | 50.0 | 65.0 | |
Diploma | 200 | 25.0 | 25.0 | 90.0 | |
Certificates | 40 | 5.0 | 5.0 | 95.0 | |
Below Certificates | 40 | 5.0 | 5.0 | 100.0 | |
Total | 800 | 99.9 | 100.0 | ||
Missing | System | 1 | 0.1 | ||
Total | 801 | 100.0 |
Source: Authors
Table 4: Experience
Freq. | % | % valid | Cumulative % | ||
Valid | 0-3 Months | 40 | 5.0 | 5.0 | 5.0 |
7-9 Months | 40 | 5.0 | 5.0 | 10.0 | |
10-12 Months | 120 | 15.0 | 15.0 | 25.0 | |
1-2 Years | 320 | 40.0 | 40.0 | 65.0 | |
3 Years and above | 280 | 35.0 | 35.0 | 100.0 | |
Total | 800 | 99.9 | 100.0 | ||
Missing | System | 1 | 0.1 | ||
Total | 801 | 100.0 | |||
Source: Authors
Discussion
Discussion of results of study
Reliability
100% of the respondents indicated that the service characteristics of reliability of keeping promises (100%), interest in solving customers problems (100%), interest in solving the right problem at the first time (95%), commitment to fulfil the service (100%) and persistence at performing the service consistently (100%) as essential determinants of hotel service quality as shown in table 5 to table 9 below. The findings are in coherence with the outcome of the following researches (Mhlanga, 2018: Musikavanhu, 2017 : Yang and Campos, 2019 : Bhuaian, 2020 : Sadick (2020); Sulemana et al., 2023 : Hammanjoda et al., 2023 : Chiguvi and Gabasiane, 2023 : Asgeirsson et al., 2024 : Adetola and Adeosun, 2024 and Kumar, 2024). Conversely this was in contrast to the findings of Yang and Campos (2019).
Tangibles
Approximately more than 67% of the respondents agreed that the tangibles are important determinants of hotel service quality in relation to layout of equipment (68%), physical environment (79%), physical appearance of contributors (78%) and materials associated with the provision of the services (68%) as shown in table 10 to table 13 below. The results concurs with the following outcomes from Fidzai and Caughey (2014), Mhlanga (2018), Kiran and Kumar (2019), Nunkoo et al. (2019), Li et al. (2020), Singh and Kumar (2020), Nkwede et al. (2022), Li et al. (2020), Bhuaian (2020), Garg et al. (2020), Matenge (2021), Sulemana et al. (2023), Hammanjoda et al. (2023), Chiguvi and Gabasiane (2023), Chatibura (2023), Sadick (2020), Asgeirsson et al. (2024), Perdomo-Verdecia et al. (2024) and Adetola and Adeosun (2024). However, this was in contrast to the findings of Yang and Campos (2019).
Responsiveness
More than 83% of the respondents agreed that responsiveness was one of the determinants of service quality with reference to the commitment to established deadlines (95%), readiness for customer service (84%), willingness to solve problems (89%) and availability for solving customer questions (89%) as shown from table 14 to table 17 below. These findings are consistent with the findings of Mhlanga (2018), Sadick (2020), Nunkoo et al. (2019), Bhuaian (2020), Meshack and Prusty (2021), Wu et al. (2021), Sulemana et al. (2023), Hammanjoda et al. (2023), Motshegwa and Oshamo (2024) and Kumar (2024).
Assurance
Approximately 85% of the respondents agreed that assurance in the provision of hotel service quality is an important factor in relation to employees inspiring customer confidence (100%), customers feeling secure when interacting with institution (94%), courtesy and education of employees (95%) and in the provision of sustainable hotel services (84%) as shown in table 18 to table 21 below. The results are in tandem with those from Musikavanhu (2017), Nunkoo et al. (2019), Nyagadza et al. (2022), Nkwede et al. (2022), Bhuaian (2020), Phiphopaekasit and Anunthawichak (2022), Sulemana et al. (2023), Asgeirsson et al. (2024) . The results contradict the results of Hammanjoda et al. (2023), Fredericks (2023), Adetola and Adeosun (2024), Motshegwa and Oshamo (2024) and Kumar (2024).
Empathy
More than 88% of the respondents indicated empathy as a determinant of hotel service quality in relation to providing individualized attention to customers (95%), providing convenient schedules for customers (95%), rendering personalized service to customers (95%), focusing to providing the best service to customers (89%) and understanding the specific needs of customers (90%) as shown in table 22 to table 26 below. The results reasonates with those of Musikavanhu (2017), Yang and Campos (2019), Singh and Kumar (2020), Sadick (2020), Nkwede et al. (2022), Bhuaian (2020), Garg et al. (2020), Wu et al. (2021), Sulemana et al. (2023), Hammanjoda et al. (2023), Adetola and Adeosun (2024) and Kumar (2024).
NB. The following abbreviations were used in the following tables: N-Neutral; DSA-Disagree; A-Agree; SA-Strongly Agree.
Table 5: Reliability-Keeping Promises
A5 | |||||
Freq. | % | % valid | Cumulative % | ||
Valid | A | 253 | 31.6 | 31.6 | 31.6 |
SA | 547 | 68.4 | 68.4 | 100.0 | |
Sum | 800 | 100.0 | 100.0 | ||
Source: Authors, 2024
Table 6: Reliability-Interest in Solving Customers Problem
A6 | |||||
Freq. | % | % valid | Cumulative % | ||
Valid | A | 294 | 36.8 | 36.8 | 36.8 |
SA | 506 | 63.3 | 63.3 | 100.0 | |
Sum | 800 | 100.0 | 100.0 | ||
Source: Authors, 2024
Table 7: Reliability- Interest at Solving the Right Problem at First Time
A6 | |||||
Freq. | % | % valid | Cumulative % | ||
Valid | N | 42 | 5.3 | 5.3 | 5.3 |
A | 422 | 52.8 | 52.8 | 58.0 | |
SA | 336 | 42.0 | 42.0 | 100.0 | |
Sum | 800 | 100.0 | 100.0 | ||
Source: Authors, 2024
Table 8: Reliability- Commitment to Fulfil the Service
A8 | |||||
| Freq. | % | % valid | Cumulative % | |
Valid | A | 126 | 15.8 | 15.8 | 15.8 |
SA | 674 | 84.3 | 84.3 | 100.0 | |
Total | 800 | 100.0 | 100.0 | ||
Source: Authors, 2024
Table 9: Reliability- Persistence in Performing the Service Correctly
A9 | |||||
| Freq. | % | % valid | Cumulative % | |
Valid | A | 252 | 31.5 | 31.5 | 31.5 |
SA | 548 | 68.5 | 68.5 | 100.0 | |
Sum | 800 | 100.0 | 100.0 | ||
Source: Authors, 2024
Table 10: The Tangibles-Equipment
A1 | |||||
| Freq. | % | % valid | Cumulative % | |
Valid | DSA | 84 | 10.5 | 10.5 | 10.5 |
N | 168 | 21.0 | 21.0 | 31.5 | |
A | 338 | 42.3 | 42.3 | 73.8 | |
SA | 210 | 26.3 | 26.3 | 100.0 | |
Sum | 800 | 100.0 | 100.0 | ||
Source: Author, 2024
Table 11: The Tangible-Physical Environment
A2 | |||||
Freq. | % | %Valid | Cumulative % | ||
Valid | N | 168 | 21.0 | 21.0 | 21.0 |
A | 548 | 68.5 | 68.5 | 89.5 | |
SA | 84 | 10.5 | 10.5 | 100.0 | |
Sum | 800 | 100.0 | 100.0 | ||
Source, Author, 2024
Table 12: The Tangible- Physical Appearance of Contributors
A3 | |||||
Freq. | % | %Valid | Cumulative % | ||
Valid | N | 252 | 31.5 | 31.5 | 31.5 |
A | 422 | 52.8 | 52.8 | 84.3 | |
SA | 126 | 15.8 | 15.8 | 100.0 | |
Sum | 800 | 100.0 | 100.0 | ||
Source: Author, 2024
Table 13: The Tangible-Materials Associated with Provision of Services
A4 | |||||
Freq. | % | %Valid | Cumulative % | ||
Valid | DSA | 126 | 15.8 | 15.8 | 15.8 |
N | 210 | 26.3 | 26.3 | 42.0 | |
A | 338 | 42.3 | 42.3 | 84.3 | |
SA | 126 | 15.8 | 15.8 | 100.0 | |
Sum | 800 | 100.0 | 100.0 | ||
Source: Author, 2024
Table 14: Responsiveness- Commitment to Established Deadlines
A10 | |||||
Freq. | % | %Valid | Cumulative % | ||
Valid | N | 42 | 5.3 | 5.3 | 5.3 |
A | 379 | 47.4 | 47.4 | 52.6 | |
SA | 379 | 47.4 | 47.4 | 100.0 | |
Sum | 800 | 100.0 | 100.0 | ||
Source: Authors, 2024
Table 15: Responsiveness-Readiness for Customer Service
A11 | |||||
Freq. | % | %Valid | Cumulative % | ||
Valid | N | 126 | 15.8 | 15.8 | 15.8 |
A | 210 | 26.3 | 26.3 | 42.0 | |
SA | 464 | 58.0 | 58.0 | 100.0 | |
Sum | 800 | 100.0 | 100.0 | ||
Source: Authors, 2024
Table 16: Responsiveness-Willingness to Solve Problems
A12 | |||||
Freq. | % | %Valid | Cumulative % | ||
Valid | N | 84 | 10.5 | 10.5 | 10.5 |
A | 294 | 36.8 | 36.8 | 47.3 | |
SA | 422 | 52.8 | 52.8 | 100.0 | |
Sum | 800 | 100.0 | 100.0 | ||
Source: Authors, 2024
Table 17: Responsiveness-Availability for Solving Customer Problems
A13 | |||||
Freq. | % | %Valid | Cumulative % | ||
Valid | N | 84 | 10.5 | 10.5 | 10.5 |
A | 294 | 36.8 | 36.8 | 47.3 | |
SA | 422 | 52.8 | 52.8 | 100.0 | |
Sum | 800 | 100.0 | 100.0 | ||
Source: Authors, 2024
Table 18: Assurance-Employees Inspire Customer Confidence
A14 | |||||
Freq. | % | %Valid | Cumulative % | ||
Valid | A | 294 | 36.8 | 36.8 | 36.8 |
SA | 506 | 63.3 | 63.3 | 100.0 | |
Sum | 800 | 100.0 | 100.0 | ||
Source: Authors, 2024
Table 19: Assurance- Feel Secure When Interacting with Institutions
A15 | |||||
Freq. | % | %Valid | Cumulative % | ||
Valid | N | 42 | 5.3 | 5.3 | 5.3 |
A | 295 | 36.9 | 36.9 | 42.1 | |
SA | 463 | 57.9 | 57.9 | 100.0 | |
Sum | 800 | 100.0 | 100.0 | ||
Source: Authors, 2024
Table 20: Assurance-Courtesy and Education of Employees
A16 | |||||
Freq. | % | %Valid | Cumulative % | ||
Valid | N | 42 | 5.3 | 5.3 | 5.3 |
A | 378 | 47.3 | 47.3 | 52.5 | |
SA | 380 | 47.5 | 47.5 | 100.0 | |
Sum | 800 | 100.0 | 100.0 | ||
Source: Authors, 2024
Table 21: Assurance-Provision of Sustainable Hotel Services
A17 | |||||
Freq. | % | %Valid | Cumulative % | ||
Valid | N | 126 | 15.8 | 15.8 | 15.8 |
A | 252 | 31.5 | 31.5 | 47.3 | |
SA | 422 | 52.8 | 52.8 | 100.0 | |
Sum | 800 | 100.0 | 100.0 | ||
Source: Authors, 2024
Table 22: Empathy- Individualized Attention to Customers
A18 | |||||
Freq. | % | %Valid | Cumulative % | ||
Valid | N | 42 | 5.3 | 5.3 | 5.3 |
A | 210 | 26.3 | 26.3 | 31.5 | |
SA | 548 | 68.5 | 68.5 | 100.0 | |
Sum | 800 | 100.0 | 100.0 | ||
Source: Authors, 2024
Table 23: Empathy-Convenient Schedules for Customers
A19 | |||||
Freq. | % | %Valid | Cumulative % | ||
Valid | N | 42 | 5.3 | 5.3 | 5.3 |
A | 210 | 26.3 | 26.3 | 31.5 | |
SA | 548 | 68.5 | 68.5 | 100.0 | |
Sum | 800 | 100.0 | 100.0 | ||
Source: Authors, 2024
Table 24: Empathy-Personalized Service to Customers
A20 | |||||
Freq. | % | %Valid | Cumulative % | ||
Valid | N | 42 | 5.3 | 5.3 | 5.3 |
A | 252 | 31.5 | 31.5 | 36.8 | |
SA | 506 | 63.3 | 63.3 | 100.0 | |
Sum | 800 | 100.0 | 100.0 | ||
Source: Authors, 2024
Table 25: Empathy-Attention to Provide the Best Service to Customers
A21 | |||||
Freq. | % | %Valid | Cumulative % | ||
Valid | N | 84 | 10.5 | 10.5 | 10.5 |
A | 168 | 21.0 | 21.0 | 31.5 | |
SA | 548 | 68.5 | 68.5 | 100.0 | |
Sum | 800 | 100.0 | 100.0 | ||
Source: Authors, 2024
Table 26: Empathy-Understanding the Specific needs of Customers
A22 | |||||
Freq. | % | %Valid | Cumulative % | ||
Valid | N | 84 | 10.5 | 10.5 | 10.5 |
A | 252 | 31.5 | 31.5 | 42.0 | |
SA | 464 | 58.0 | 58.0 | 100.0 | |
Sum | 800 | 100.0 | 100.0 | ||
Source: Authors, 2024
Discussion of Reliability Analysis and Sampling Adequacy for Scale Items
A Cronbachâs alpha of more than 0.5 was obtained for most of the data items, except for reliability measure, reflecting sufficient reliability of the scale items. Hansjosten (2015) affirmed that values of Cronbachâs Alpha between 0.5 and 0.7 were acceptable whilst values between 0.7 and 0.9 were the best indicators of internal stability of the scale items used. Further a KMO of at least 0.5 was obtained for each of the scale items showing sampling adequacy of the data items prior to conducting confirmatory factor analysis and SEM. Kaiser (1974) in Munasinghe and Bernard (2020) recommended a value of 0.5 for KMO as minimum, barely accepted, KMO values between 0.7-0.8 as acceptable, and KMO values above 0.9 were regarded as excellent. The data items for the study were considered reliable and the sample adequate for the purpose of conducting confirmatory factor analysis and SEM on the data as shown in table 27 below. A path diagram for the structural equation concept model A is illustrated in figure 1 below.
Table 27: Summary of Cronbachâs Alpha & KMO test results
Scale Measurement Item | All data items | Tangible | Reliability | Responsiveness | Assurance | Empathy | Service Quality |
Cronbachâs Alpha for Reliability Analysis | 0.810 | 0.649 | 0.384 | 0.568 | 0.595 | 0.890 | 0.863 |
Kaiser Meyers Olkins (KMO) test for Sampling Adequacy | 0.558 | 0.493 | 0.722 | 0.726 | 0.795 | 0.760 |
Source: Authors, 2024
Discussions of the Descriptive Statistics for Data Items
The statistical output tables from SPSS illustrated that at least 70% of the participants agreed that all the hotel service characteristics of the tangible, reliability, responsiveness, assurance and empathy are significant contributors towards the attainment of high levels of hotel service quality as shown in table 28 to 32. This is in agreement with the studies of Bhuaian (2020), Sulemana et al. (2023) and Kumar (2024).
Table 28: SERVQUAL-Tangibles
A23 | |||||
Freq. | % | %Valid | Cumulative % | ||
Valid | N | 80 | 10.0 | 10.0 | 10.0 |
A | 416 | 52.0 | 52.0 | 62.0 | |
SA | 304 | 38.0 | 38.0 | 100.0 | |
Sum | 800 | 100.0 | 100.0 | ||
Source: Authors, 2024
Table 29: SERVQUAL-Reliability
A24 | |||||
Freq. | % | %Valid | Cumulative % | ||
Valid | N | 120 | 15.0 | 15.0 | 15.0 |
A | 480 | 60.0 | 60.0 | 75.0 | |
SA | 200 | 25.0 | 25.0 | 100.0 | |
Sum | 800 | 100.0 | 100.0 | ||
Source: Authors, 2024
Table 30: SERVQUAL-Responsiveness
A25 | |||||
Freq. | % | %Valid | Cumulative % | ||
Valid | N | 160 | 20.0 | 20.0 | 20.0 |
A | 160 | 20.0 | 20.0 | 40.0 | |
SA | 480 | 60.0 | 60.0 | 100.0 | |
Sum | 800 | 100.0 | 100.0 | ||
Source: Authors, 2024
Table 31: SERVQUAL- Assurance
A26 | |||||
Freq. | % | %Valid | Cumulative % | ||
Valid | N | 120 | 15.0 | 15.0 | 15.0 |
A | 200 | 25.0 | 25.0 | 40.0 | |
SA | 480 | 60.0 | 60.0 | 100.0 | |
Sum | 800 | 100.0 | 100.0 | ||
Source: Authors, 2024
Table 32: SERVQUAL- Empathy
A27 | |||||
Freq. | % | %Valid | Cumulative % | ||
Valid | N | 160 | 20.0 | 20.0 | 20.0 |
A | 160 | 20.0 | 20.0 | 40.0 | |
SA | 480 | 60.0 | 60.0 | 100.0 | |
Sum | 800 | 100.0 | 100.0 | ||
Source: Authors, 2024
Discussions of the findings from the Structural Equation Modelling (SEM) of the Study
The Structural Equation Model A revealed that hotel service quality is significantly and positively correlated with hotel service dimensions of responsiveness, tangibles and assurance as shown in figure 1 below. Therefore, the null hypothesis of the study was rejected. This concurs with findings of Mhlanga (2018), Sadick (2020), Nunkoo et al. (2019), Bhuaian (2020), Meshack and Prusty (2021), Wu et al. (2021), Sulemana et al. (2023), Hammanjoda et al. (2023), Motshegwa and Oshamo (2024) and Kumar (2024), Fidzai and Caughey (2014), Mhlanga (2018), Kiran and Kumar (2019), Nunkoo et al. (2019), Li et al. (2020), Singh and Kumar (2020), Nkwede et al. (2022), Li et al. (2020), Bhuaian (2020), Garg et al. (2020), Matenge (2021), Sulemana et al. (2023), Hammanjoda et al. (2023), Chiguvi and Gabasiane (2023), Chatibura (2023), Sadick (2020), Asgeirsson et al. (2024), Perdomo-Verdecia et al. (2024) and Adetola and Adeosun (2024). Musikavanhu (2017), Nunkoo et al. (2019), Nyagadza et al. (2022), Nkwede et al. (2022), Bhuaian (2020), Phiphopaekasit and Anunthawichak (2022), Sulemana et al. (2023), Asgeirsson et al. (2024) . The results contradict the results of Hammanjoda et al. (2023), Adetola and Adeosun (2024), Motshegwa and Oshamo (2024) and Kumar (2024). However, the operational hypotheses Hia, H1c, and H1e were accepted.
Further hotel service quality was observed to be significantly and negatively correlated with reliability and empathy as shown in figure 2 below. The alternative hypotheses for H1b and H1d were rejected. The results contradicted that of Bhuaian (2020), Meshack and Prusty (2021) and Sulemana et al. (2023).
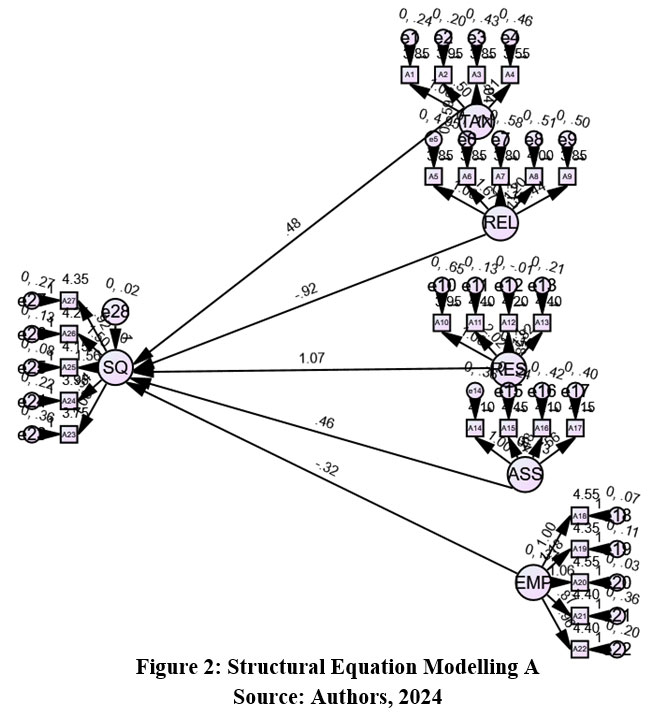 | Figure 2: Structural Equation Modelling A
|
Source: Authors, 2024
Conclusion
All the characteristics of hotel service relating to the tangible, reliability, responsiveness, assurance and empathy are necessarily required towards the achievement of optimum hotel service quality. However, the study identified the tangibles, assurance and responsiveness as service quality dimensions that significantly and positively correlate with hotel service quality in the context of the hotel and motel industry in Botswana. It can be concluded that the key determinants of hotel service quality in Botswana are the service characteristics of the tangibles, responsiveness and assurance. Most customers especially foreign guests are environmental and sustainability conscious and rather strongly do not want to be associated with hotels structures and activities that contribute to emissions of carbon dioxide, methane and other gases that cause global warming, climate change and climate risk.
Recommendations
Hotel managers are recommended to focus more attention on satisficing customersâ needs through the deployment of all the hotel service quality dimensions but need to pay special attention to the creation of well appealing sustainable hotel architecture, providing high levels of service assurance and provision of timeous responses to customers concerns. The provision of sustainable hotel services is pertinent assurance issue for hotel guests and hotels and motels must demonstrate clearly to guests in their marketing campaigns and through initiation of fundamental changes to processes and activities in transition to climatic change resilience. Lastly hotels are strongly encouraged to revolutionize their energy sources and become climate change compliant to avoid deliberate emissions of carbon dioxide, methane and other gases that contributes to physical climatic risk. Hotels and Motels services strategies and capabilities should drive hotel processes towards green hotel services to enhance the assurance hotel quality dimension.
Acknowledgement
The author is grateful to the Department of Tourism and Ministry of Environment and Tourism Headquarters Botswana for granting us with a research permit to conduct the research in the hospitality industry of Botswana.
Funding Sources
The authors received no financial support for the research, authorship, and/or publication of this article
Conflicts of Interest
The authors do not have any conflict of interest.
Data Availability Statement
The corresponding author can provide the data from this study upon request. Due to limitations, the data are not publicly accessible.
Ethics Statement
Testing of any material, animal subjects which required ethical approval were not part of the research. However the researchers obtained a research permit to administer the questionnaires on human subjects in the financial markets of Botswana.
Informed Consent Statement
Every participant in the study provided their informed consent.
Permission to reproduce material from other sources
No materials were reproduced but figures and tables were the result of research data that were processed through SPSS and AMOS for structural equation modelling.
Author Contributions:
Wilbert Kudakwashe Chidaushe: WritingâReview and Editing, Conceptualization, Methodology, and Resources
Stegi Shine: WritingâOriginal Draft, WritingâReview and Editing, Validation, Formal Analysis.
Mini Sebastian: WritingâReview and Editing, Methodology, Formal Analysis, Investigation
Reference
- Adetola B.O. and Adeosun F. O. (2024). Determinants of Customers Satisfaction with Service Quality in selected Hospitality Outlets in Ondo State, Nigeria. International Journal of Research Publication and Reviews, 5(2):2600-2613. : https://doi.org/10.55248/gengpi.5.0224.0552.
CrossRef - Abdullah, O., Sufi, T. & Kumar, S. (2022). Service Quality and its Influence on Customer Satisfaction and Customer Loyalty in the Restaurants of Five-Star Hotels. African Journal of Hospitality, Tourism and Leisure, 11(6):2173-2189. DOI: https://doi.org/10.46222/ajhtl.19770720.349.
- Asgeirsson, M. H., Gudlaugsson, T., and Jóhannesson, G. T. (2024). The Relationships between Service Quality, Reputation, and Performance in Hospitality, 5(3):736-752. https://doi.org/10.3390/tourhosp5030043
CrossRef - Berg, B. L. (2007). Qualitative Research Methods for the Social Sciences. (6th ed). USA: Pearson Educational Inc.
- Botswana Communication Regulatory Authority (BOCRA). (2014). Survey on internet connectivity in key strategic areas in Botswana (Hospitality Facilities). https://www.bocra.org.bw/sites/default/files/documents/Study.pdf
- Bhuian, D. (2020). The Impact of Service Quality on Customer Satisfaction in Hotel Business Development.https://www.diva-portal.org/smash/get/diva2:1582843/FULLTEXT01.pdf. Accessed on 09 September 2024.
- Blunch, N.J. 2013. Introduction to structural equation modeling using IBM SPSS statistics and AMOS. 2nd ed. London: Sage Publications Ltd.
CrossRef - Bryman, A. (2012). Social Research Methods. 4th edition. New York: Oxford University Press.
- Chatibura, D.H. (2023). A Hedonic Analysis of the Determinants of Hotel Room Rates in the Greater Gaborone Region (Botswana) using quantile regression. International H,ospitality Review.https://www.emerald.com/insight/ content/ doi/10.1108/IHR-02-2023-0012/full/html
CrossRef - Chiguvi, D. and Gabasiane, A. (2023). Factors and Challenges Affecting the Tourism Sector: An In-Depth Analysis of Botswanaâs Tourism. 11(2)pp. 118-135.
- Christensen, L. and Johnson, R. B. (2020). Educational Research: Quantitative, Qualitative, and Mixed Approaches.Sage ISBN: 9781544337838
- Cohen, L. Manion, L. and Morrison, K. (2011). Research Methods in Education. (7th ed.). Oxon OX14 4RN: Routledge.
- Creswell, J. W. (2009). Research design: Qualitative and mixed methods approach. London: SAGE.
- Cronin, J.J. and Taylor, S.A. (1992), âMeasuring service quality: a re-examination and extensionâ,Journal of Marketing, Vol. 56 No. 3, pp. 55-68.
CrossRef - Daniel, E. (2016). The Usefulness of Qualitative and Quantitative Approaches and Methods in Researching Problem-Solving Ability in Science Education Curriculum. Journal of Education and Practice www.iiste.org ISSN 2222-1735 (Paper) ISSN 2222-288X (Online) Vol.7, No.15, 2016.
- Denscombe, M. (1998). The Good Research for Small âScale Social Research Project. Philadelphia: Open University Press.
- Fredericks, l. (2023). Sustainable Hotel Ideas: 25 Ways to go green. https://www.cvent.com/en/blog/hospitality/eco-friendly-hotel-ideas. Accessed on 21 September 2024.
- Fidzai, L.C and Caughey, C. (2014). First Impressions of Hotel Lobbies as Inferences About Hotels: A Marketing Tool. Botswana Journal of Business Volume 7 No. 1.
- Hansjosten, H. (2015). Scientific Accuracy of the Methodology. https://leonardo345.com/wa_files/ Leonardo_203_4_5__ 20statistical_20report_202015_20.pd
- Hammanjoda, K., Safiyanyu, A., and Usman J. (2023). Service quality in hotels: Understanding customersâ perceptions for improved guest satisfaction. Journal of Economics and Allied Research,8(2):49-59.
- Hoyle, R.H. 2015. Introduction and overview. (In Hoyle, R.H. ed. Handbook of structural equation modelling. 1st ed. New York: The Guilford Press. p. 3-16).
- Kiran,P. and Kumar, A. (2019). Determinants of Service Quality Attributes in Hotel Industry (MPSTDC*) Leading to Customer Satisfaction. Tourism Innovations, 9(1):23-37.https://www.researchgate.net/publication/333965122.
- Kumar, M. (2024). Exploring the Correlation Between Service Quality and Customer Satisfaction in the Hospitality Industry. The International Journal of Indian. Psychology. Vol 12(1), pp1400-1410.
- Lashely, C. and Morrison, A. (eds) (2000). I n Search of Hospitality: Theoretical Perspectives and Debates, Oxford: Butterworth-Heinemann. Routledge.
- Li, H., HYPERLINK "https://www.emerald.com/insight/search?q=Yong%20Liu"
- Liu,Y., HYPERLINK "https://www.emerald.com/insight/search?q=Chee-Wee%20Tan"Chee-Wee Tan, C.-W., and HYPERLINK "https://www.emerald.com/insight/search?q=Feng%20Hu"Hu, F. (2020). Comprehending customer satisfaction with hotels:Data analysis of consumer-generated reviews. International Journal of Contemporary Hospitality Management, 32(5):1713-1735.International Journal of Contemporary Hospitality Management.
CrossRef - Lichtman, M. (2013). Qualitative Research in Education: A Userâs Guide. (3rd ed). USA: SAGE Publication.
- Garg,S. K., Ghai, M., and Ahlawat, R. (2020). Factors influencing perception of service quality in hotels. Conference Paper: The "New normal? in Management, Social Sciences & Economic Development At: Gwalior. Accessed on 31 August 2024.
- Gajic, T., Vukoli?, D., Zrni?, M. and, Dénes,D.L. (2023). The quality of hotel service as a factor of achieving loyalty among visitors. Hotel and Tourism management, 11(1):67-77. http://creativecommons.org/licenses/by/4.0/).
CrossRef - Matenge, S. T. P. (2021). A Descriptive Assessment of the Quality of products and Service Delivery at a mining Canteen in Botswana. Journal of Food and Nutrition Research. 9(10), 516-522 DOI: 10.12691/jfnr-9-10-3.https://www.sciepub.com/JFNR/ abstract/13822
CrossRef - Meshack, H.E. & Prusty, S. (2021). Service Quality, Satisfaction and Loyalty of Customers in Hotels:The Case of Northern Tanzania. African Journal of Hospitality, Tourism and Leisure, 10(4):1430-1451. DOI: https://doi.org/10.46222/ajhtl.19770720-171
CrossRef - Mhlanga, O. (2018). Measuring restaurant service quality in East London, South Africa: A comparison of restaurant customer African Journal of Hospitality, Tourism and Leisure, Volume 7 (2) - (2018) ISSN: 2223-814X http//: www.ajhtl.comexpectations and perceptions.
- Motshegwa, N. and Oshamo, B. (2024). Knowledge Retention in Botswanaâs Tourism and Hospitality Industry: Challenges and Prospects. African Journal of Hospitality, Tourism and Leisure, 13(2) :430-435. DOI: https://doi.org/10.46222/ ajhtl.19770 720.525.
- Musikavanhu, G. M. (2017). A service quality framework for the Botswana hospitality sector. https://v-des-dev-lnx1.nwu.ac.za/handle/10394/26356. Accessed on August 2024.
- Nkwede, M-F. C.,?Ike-Elechi Ogba, I-E. and Nkwede, F. E. (2022). Determinants of customer satisfaction in a high-contact service environment: a study of selected hotels in Abakaliki metropolis, Nigeria. Research in Hospitality Management 2022, 12(2): 183â190. https://doi.org/10.1080/22243534.2022.2133191.
CrossRef - Nyagadza, B., Mazuruse,G., Muposhi, A. and Chigora, F. (2022). Effect of hotel overall service quality on customersâ attitudinal and behavioural loyalty: perspectives from Zimbabwe, 3(1):42-71. https://doi.org/10.1108/TRC-12-2021-0026.
CrossRef - Nunkoo R., Teeroovengadum V., Ringle, C., & Sunnassee, V. (2019). Service Quality and Customer Satisfaction:The Moderating Effects of Hotel Star Rating. International Journal of Hospitality Management.
CrossRef - Parasuraman, A., Zeithaml, V.A. and Leonard, L.B. (1988), âSERVQUAL: a multiple-item scale for measuring consumer perceptions of service qualityâ, Journal of Retailing, Vol. 64 No. 1,pp. 12-40.
- Phiphopaekasit, P., & Anunthawichak, S.-I. (2022). Path analysis to identify factors influencing customer loyalty of Green Hotel and Resort in Thailand. International Journal of Health Sciences, 6(S4), 1434â1445. https://doi.org/10.53730/ijhs.v6nS4.6244.
CrossRef - Perdomo-Verdecia, V., Garrido-Vega, P., and Sacristán-DÃaz, M. (2024). An fsQCA analysi of service quality for hotel customer satisfaction. International Journal Hospitality Management, Vol. 122.https://doi.org/10.1016/j.ijhm.2024.103793.
CrossRef - Sadick, A. (2020). Factors affecting customer satisfaction in the hospitality industry: The case study of the Tamale Metropolis. European Journal of Hospitality and Tourism Research, (1):1-11. https://www.eajournals.org/wp-content/uploads/Factors-Affecting-Customer-Satis.
- Schumacher, R.E. & Lomax, R.G. (2016). A beginnerâs guide to structural equation modeling. 4th ed. New York: Routledge.
- Shank, G. & Brown, L. (2007). Exploring Educational Research Literacy. New York: Routledge.
- Singh, M., & Kumar, D. (2020). A Study of Determinants of Service Quality and Its Role in Iraq. Business and Economic Research, Macrothink Institute, vol. 10(2): 64-85. https://ideas.repec.org/a/mth/ber888/v10y2020i2p64-85.html.
- Sulemana, A.M., Galyuoni, B, Cowther S., and Issah, A. (2023). An assessment of the impact of quality service on customersâ satisfaction and loyalty in selected hotels in Tamale Metropolis, Northern Region, Ghana, 17(3):43-52. http://www.academicjournals.org/AJBM.
CrossRef - Wu, X., Wang. J. and Ling, Q. (2021). Managing internal service quality in hotels: Determinants and implications. Tourism management, vol 86. https://doi.org/10.1016/j.tourman.2021.104329.
CrossRef - Yang, B. Y. and Campos, M. R.A. (2019). Factors affecting customer satisfaction in nternational hotels in Chenzhou city, China, 5(3):925-939. https://doi.org/10.20319/pijss.2020.53.925939.
CrossRef

This work is licensed under a Creative Commons Attribution 4.0 International License.


