
Scaling the Signal: How Firm Size Moderates the Effects of Financial Disclosures on Market and Value Metrics?
Rohit Singh1*  and Sitangshu Khatua2
1Department of Management, St. Xaviers University, Kolkata, West Bengal India .
2Xavier Business School, St. Xaviers University, Kolkata, West Bengal India .
http://dx.doi.org/10.12944/JBSFM.07.01.05
This study investigates the impact of key financial disclosures, i.e., leverage, liquidity, profitability, and investor management, on the short-term market reaction and long-term value of firms listed on the National Stock Exchange of India. Using panel data from 353 firms over a ten-year period (2014â2024), the analysis employs fixed-effects regression models to assess abnormal stock returns (one day post-disclosure) and future firm value (Tobinâs Q). The findings reveal that liquidity and profitability are consistently associated with positive market responses and enhanced firm valuation, while leverage and P/E-based investor metrics exhibit mixed or negative effects. Moreover, the study incorporates firm size as a moderating factor, showing that disclosure effects vary significantly between small and large firms. Notably, profitability and leverage have diminishing impact in larger firms, while liquidityâs positive effect is amplified. These insights not only confirm the relevance of signalling and agency theories in emerging markets but also underscore the conditional nature of disclosure interpretation. The study offers implications for corporate reporting strategies, investor analysis, and regulatory policy design.
Copy the following to cite this article:
Singh R, Khatua S. "Scaling the Signal: How Firm Size Moderates the Effects of Financial Disclosures on Market and Value Metrics?". Journal of Business Strategy Finance and Management, 7(1).
DOI:http://dx.doi.org/10.12944/JBSFM.07.01.05Copy the following to cite this URL:
Singh R, Khatua S. "Scaling the Signal: How Firm Size Moderates the Effects of Financial Disclosures on Market and Value Metrics?". Journal of Business Strategy Finance and Management, 7(1). Available here:https://bit.ly/4n09qu8
Download article (pdf) Citation Manager Publish History


Introduction
Background and Context
In an increasingly information-driven capital market, corporate financial disclosures serve as a critical interface between firms and investors. Investors depend on timely and transparent financial reporting to make informed decisions, and stock prices often react sharply to new information disclosures (Mesioye & Bakare, 2024). The relevance of such disclosures is particularly significant in emerging markets like India, where asymmetries in information flow, regulatory environments, and investor sophistication differ markedly from developed economies (Martins & de Campos Barros, 2021). Indiaâs corporate landscape has undergone rapid transformation in recent years, with increased institutional ownership, enhanced regulatory scrutiny (e.g., SEBIâs disclosure mandates), and growing participation by retail investors (ICLG, 2024). These dynamics elevate the importance of understanding how financial metrics disclosed in annual reports such as leverage, liquidity, profitability, and investor management, which influence both the immediate market response and longer-term firm valuation. Despite regulatory efforts to standardize disclosure practices, the interpretation and impact of disclosed financial ratios may vary depending on firm characteristics, particularly size (Agyei-Mensah, 2015). Larger firms may benefit from market credibility, while smaller firms face scepticism despite strong financial performance (Schreck & Raithel, 2018). This paper, therefore, seeks to unpack the dual-layered impact of financial disclosures on short-term stock returns and long-term firm value, while also investigating the moderating effect of firm size, which is a dimension underexplored in the Indian context.
Research Problem
In the dynamic capital markets in the contemporary times, the investors rely significantly on financial disclosures for decision-making. However, the impact on value and stock returns, varies widely, creating an uncertainty for stakeholders. The inconsistency is prominent in case of the Indian companies whereby the companies vary in terms of structure, scale, and investor perception. Despite the mandates in disclosure, it is unclear if all the companies benefit equally from transparency. While the larger companies might enjoy greater visibility, the smaller companies might face increased sensitivity to same information, thereby making additional disclosures less impactful in nature. This raises a practical issue regarding the ways in which companies can tailor disclosure strategies in an effective way. The study intends to address the real-world challenge of optimizing disclosure practices by examining the ways in which firm size shapes market responses to financial information.
Aims and Objectives
This study aims to empirically investigate how financial disclosures influence firm performance in the Indian capital market. Specifically, it examines the impact of leverage, liquidity, profitability, and investor-related metrics on two dimensions: (1) abnormal stock returns on the announcement date and (2) future firm value measured by Tobinâs Q.
The following objectives guide the research:
To assess the effect of financial disclosures on abnormal stock returns during announcement periods.
To evaluate the influence of these disclosures on future firm value (Tobinâs Q).
To explore whether firm size moderates the relationship between financial disclosures and both market and valuation outcomes.
The study, by addressing these objectives, contributes to a more granular understanding of how financial metrics are interpreted by investors in the Indian context, with implications for corporate reporting, investor strategy, and policy design.
Research Gap
While prior studies have explored the effect of financial disclosures on either stock returns or firm value, few have examined both dimensions simultaneously, particularly in the context of emerging markets like India. Most existing literature focuses on developed economies, where disclosure standards, investor sophistication, and market dynamics differ significantly. Moreover, there is limited empirical evidence on how firm-specific factors, especially firm size moderates the impact of financial disclosures on market responses and long-term valuation. This study addresses these gaps by investigating how key financial disclosures, i.e., leverage, liquidity, profitability, and investor metrics affect both abnormal stock returns and future firm value (Tobinâs Q) using Indian listed firms. Importantly, it introduces firm size as a moderating variable, allowing for a nuanced understanding of investor behaviour across the firm-size spectrum. By integrating event study methodology with panel data regression, the study contributes to the literature on financial communication, market efficiency, and firm valuation in emerging markets. The findings offer insights for investors, regulators, and corporate managers aiming to enhance disclosure strategies and investment decisions.
Novelty
This research contributes to the growing literature on financial disclosure and firm performance by offering a dual-perspective analysis, examining both short-term market reaction and long-term firm value using a unified empirical model. Unlike prior studies that tend to focus exclusively on either event-driven stock responses or firm valuation measures, this paper captures a more holistic picture of how financial information impacts firms over time. A key contribution is the incorporation of firm size as a moderating variable, addressing the question of whether investor responses to financial disclosures differ between large and small firms. While some global studies suggest size effects due to visibility and analyst coverage, few have empirically tested this dynamic within the Indian market context. This paper fills that gap by employing interaction terms between firm size and disclosure metrics in both event-study and panel regression frameworks. Another distinguishing feature of this study is its focus on Indian listed companies, which operate in an environment marked by regulatory evolution, structural reform, and a mix of retail and institutional investors. The unique characteristic of the Indian market includes periodic financial scandals, family ownership structures, and varying disclosure quality, which offer a rich context for exploring the implications of financial transparency. The results are expected to provide actionable insights for policymakers, investors, and corporate managers operating in or engaging with emerging markets.
The paper follows a six-chapter style structure. This introduction chapter is followed by a literature review which indicates the elaborations on the underlying theories and the past empirical evidence. Furthermore, the third chapter explains the research methodology and methods of the chapter, followed by a description of the variables and the descriptive statistics. The fourth chapter indicates the empirical results, which includes correlation and panel data regression analyses. The discussion chapter provides the links of the findings with the theories and the past evidence. Lastly, the conclusion chapter summarizes the overall findings, indicates the practical implications, and provides the prevalent limitations and the scope for future research.
Literature Review and Hypothesis Development
Underlying Theories
Signalling theory, developed by Spence (1973) posits that managers convey firm-specific information to the market through voluntary and timely disclosures to reduce information asymmetry (Azarberahman et al., 2023). In contexts where investors lack perfect information, such as emerging markets like India, whereby the financial disclosures act as credible signals of firm quality and performance. Positive financial indicators (e.g., strong liquidity or high profitability) can signal operational efficiency and stability, prompting favourable investor reactions and higher firm valuation (Blessing & Sakouvogui, 2023). Conversely, negative signals such as high leverage may trigger adverse market responses. The theory supports the idea that firms with superior internal information have incentives to distinguish themselves through transparent disclosures (Liu et al., 2024). Empirical studies have validated this theory in emerging markets, where market reactions to disclosures are especially sensitive due to limited external monitoring.
Agency theory explains the conflicts of interest between firm managers (agents) and shareholders (principals), especially when their goals diverge (Gwala & Mashau, 2023). In this framework, financial disclosures are tools to mitigate agency problems by reducing information asymmetry and enhancing transparency (Salehi et al., 2023). High leverage, for instance, may increase agency costs by incentivizing risk-shifting behaviour (Chen et al., 2021), while strong profitability and liquidity disclosures can demonstrate prudent management (Mousa et al., 2022). Regular, accurate reporting aligns managerial actions with shareholder interests and fosters investor trust (Vickneswaran, 2025). This is particularly important in India, where governance structures often feature concentrated ownership and family control. Studies such as Jan et al. (2021) emphasize that improved disclosure practices can function as governance mechanisms, disciplining managerial behaviour and protecting minority shareholders in emerging markets.
Financial Disclosures, Stock Returns and Firm Value
Leverage
Leverage, typically measured by the debt-to-equity ratio, reflects a firmâs reliance on borrowed capital to finance its operations. From a market reaction standpoint, high leverage is often perceived negatively due to its association with financial risk and potential default (Santos & Veronesi, 2022). Event studies have shown that announcements revealing higher-than-expected leverage ratios tend to trigger adverse stock price reactions (Indrayono, 2021). This is because investors may interpret high debt levels as a sign of poor financial discipline or increasing vulnerability to economic shocks (Zajontz, 2022). In the Indian context, where investors may be particularly cautious about financial stability given past corporate debt defaults, market sensitivity to leverage announcements is amplified. However, leverage can also be neutral or even positive if the market perceives the debt as being used for value-enhancing investments (Tron et al., 2025; Glova & Panko, 2025). The actual direction of market response depends heavily on the perceived strategic intent and the firmâs historical credibility.
H1a: Financial leverage disclosures have a negative effect on abnormal stock returns around the announcement date.
In the long term, leverage influences firm value through its effects on capital structure efficiency and cost of capital (Kruk, 2021). While moderate debt can enhance firm value via tax shields and financial discipline, excessive leverage may lead to higher bankruptcy risk, agency costs, and reduced managerial flexibility (Michalkova et al., 2021). Studies have also found a non-linear relationship between leverage and Tobinâs Q (Orabi Awad & Mohamed Ali, 2022), suggesting that both under-leveraging and over-leveraging can depress valuation. High leverage also signals potential difficulties in raising additional funds, limiting future growth opportunities (Akhtar et al., 2022). Moreover, in markets like India, where creditor rights enforcement can be inefficient, excessive reliance on debt may further deteriorate firm value due to prolonged financial distress scenarios (Serrasqueiro et al., 2025). Thus, while leverage is a critical component of capital structure, its impact on firm value depends on achieving an optimal balance relative to firm size, industry norms, and macroeconomic stability.
H2a: Financial leverage disclosures have a negative effect on firm value.
Liquidity
Liquidity, often proxied by the cash ratio or current ratio, indicates a firmâs ability to meet its short-term obligations. From an investorâs perspective, higher liquidity is generally viewed positively, especially during uncertain periods, as it reduces the probability of default or operational disruption (Zhao et al., 2024). Event studies, including those show that stock prices tend to respond favourably to liquidity-related disclosures, especially in crisis contexts where financial resilience is valued (Al Janabi, 2024). In the Indian market, where investors are particularly sensitive to solvency issues due to past corporate collapses (e.g., IL&FS, DHFL), firms with stronger liquidity positions tend to generate positive abnormal returns upon disclosure (Asri, 2024). However, the market response may be tempered if excessive liquidity is interpreted as inefficient cash hoarding, suggesting a lack of investment opportunities. Therefore, while liquidity generally improves stock reactions (Anoop, 2024), its effect depends on investorsâ perceptions of whether the retained cash is strategically deployed.
H1b: Financial liquidity disclosures have a positive effect on abnormal stock returns around the announcement date.
Liquidity also plays a crucial role in determining a firmâs long-term value. Adequate liquidity ensures the firm can sustain operations, invest in strategic opportunities, and withstand macroeconomic shocks (Ndruru, 2025). A strong liquidity position can enhance credit ratings and reduce the cost of capital, both of which are favourable for future valuation (Chouaibi et al., 2022). In volatile financial environment, where access to capital can be inconsistent, firms with stable liquidity are more likely to be rewarded with a higher Tobinâs Q (Ahmad et al., 2023). However, there is a caveat, stating that very high liquidity levels may reflect managerial conservatism or missed growth opportunities, leading to reduced efficiency and a lower valuation over time (Akbar et al., 2021). Recent empirical work has shown that firms with optimal, rather than excessive liquidity outperform in terms of value creation (Ambadapudi & Matai, 2024). Thus, liquidityâs impact on firm value is contingent on striking a balance between safety and strategic deployment of resources.
H2b: Financial liquidity disclosures have a positive effect on firm value.
Profitability
Profitability, commonly measured using Return on Equity (ROE) or Net Profit Margin, signals operational success and managerial efficiency. Strong profitability disclosures typically elicit positive stock market reactions, as they suggest value creation and sustainable earnings (Zhang et al., 2022). Event studies have shown that firms announcing higher-than-expected profits experience significant abnormal returns around disclosure dates (Li & Hou, 2024). In the Indian context, where retail investor sentiment plays a large role in market movements, profitable firms often experience amplified price reactions (Bhattacharya, 2022). However, investors may also scrutinize the quality of earnings, i.e., one-off gains or unsustainable margins can dampen enthusiasm (Zeidan, 2025). Moreover, firms that report consistent profits but fail to meet aggressive analyst forecasts may see muted or even negative stock responses (Cong et al., 2024). Thus, profitability does matter for stock returns, but the reaction is conditioned by expectations, earnings quality, and perceived future potential.
H1c: Financial profitability disclosures have a positive effect on abnormal stock returns around the announcement date.
Over the long term, profitability is a key determinant of firm value, as it drives retained earnings, capital reinvestment, and growth capacity. Firms that consistently generate high ROE or profit margins are generally awarded higher Tobinâs Q ratios, reflecting market confidence in their ability to generate future economic value (Mysaka & Derun, 2021). In India, profitability is especially valued given the frequent volatility in earnings caused by regulatory shifts and macroeconomic instability. Moreover, sustained profitability enhances bargaining power with creditors and investors, improving access to capital at lower costs (Aflatooni et al., 2022). However, not all profitability is value-creating, and therefore, the firms must balance margins with growth, reinvestment, and strategic risk-taking (Ishaq et al., 2021). Some high-profit firms are penalized for underinvestment or excessive dividend payouts. Recent studies on emerging countries also caution against assuming a linear relationship, as profitabilityâs marginal effect on valuation may decline for large, mature firms (Dickler et al., 2022). Therefore, context and consistency are key to profitabilityâs value impact.
H2c: Financial profitability disclosures have a positive effect on firm value.
Investor Management
Investor management disclosures, proxied by the price-to-earnings (P/E) ratio, reflect how the market values a firmâs earnings. A high P/E ratio may signal investor optimism and expectations of future growth, potentially driving short-term stock price appreciation (Park, 2021). Event studies in emerging markets, have shown that announcements accompanied by higher P/E multiples often lead to immediate positive stock returns, especially when aligned with upward earnings revisions (Stephans, 2021). However, high P/E ratios may also raise red flags about overvaluation (Sidiq et al., 2024), particularly if earnings growth is not supported by fundamentals. In such cases, the market may respond with scepticism or price corrections. Conversely, a low P/E ratio may indicate undervaluation, attracting value investors if, accompanied by strong financial disclosures (Munir et al., 2024). Therefore, while investor management metrics influence stock returns, their impact is filtered through investor sentiment, prevailing market trends, and broader economic expectations.
H1d: Investor management disclosures have a positive effect on abnormal stock returns around the announcement date.
Over the long term, the P/E ratio can influence firm value by shaping external perceptions of growth, risk, and earnings quality. A consistently high P/E ratio may contribute to a higher Tobinâs Q, reflecting investor confidence in the firmâs future cash flows (Mysaka & Derun, 2021). However, in the absence of corresponding earnings growth or strategic expansion, an inflated P/E can signal speculative overvaluation (de Alencar Vilela, 2024), which eventually depresses firm value when expectations are not met. In emerging economies, firms with elevated P/E ratios are often under greater scrutiny, particularly from institutional investors, as capital markets become more sophisticated (Yahaya, 2025). On the other hand, firms with stable or improving P/E ratios, backed by robust earnings performance are likely to achieve stronger valuations over time (Sam, 2025). The impact on Tobinâs Q thus depends on whether the market perceives the P/E multiple as justified. Investor management, as signalled by the P/E ratio, must therefore align with earnings trajectory and strategic positioning to enhance firm value.
H2d: Investor management disclosures have a positive effect on firm value.
Moderating Role of Size
Firm size plays a critical moderating role in how investors interpret financial disclosures, influencing both immediate market responses and long-term valuation. Larger firms, typically with more visibility, established reputations, and better analyst coverage, benefit from lower information asymmetry compared to smaller firms (Hao & Li, 2021). In contrast, small and mid-sized enterprises (SMEs) often struggle with credibility and limited disclosure reach (Gernsheimer et al., 2024), making investor interpretation of their financial reports more volatile and reactive. This difference in investor trust and transparency significantly alters the market and valuation effects of disclosed metrics (Platt, 2022), such as leverage, liquidity, profitability, and investor-focused indicators.
For instance, the adverse impact of high leverage is generally more pronounced for smaller firms, as investors perceive them to have limited access to refinancing and a higher risk of distress. In contrast, large firms can often sustain higher debt loads due to diversified operations and stronger banking relationships (Khan et al., 2021). Recent studies show that leverage disclosures lead to sharper stock price declines for small-cap Indian firms (Gurani, 2023), while large firms experience a muted or neutral response. On the valuation front, excessive leverage still erodes Tobinâs Q across all sizes, but the moderation by firm size is evident in how quickly and deeply investor confidence is shaken.
Similarly, liquidity disclosures tend to be more favourably received for large firms, where cash reserves are often interpreted as strategic buffers or investment flexibility. In smaller firms, however, excess liquidity can raise concerns about underinvestment or inefficient capital deployment (Akhtar, 2025). Research by suggests that for SMEs, high liquidity ratios do not translate to higher market value unless paired with clear reinvestment strategies (Sardo et al., 2022). Thus, firm size moderates the perceived usefulness and implications of liquidity metrics.
Profitability disclosures are also subject to size-related interpretation. In small firms, strong ROE or margin figures may signal rapid growth or operational turnaround (Odhoj et al., 2024), often resulting in immediate stock appreciation. For large firms, however, such profitability may be âpriced inâ or expected, leading to more subdued market reactions. Over time, profitability tends to enhance Tobinâs Q for firms of all sizes, but the magnitude is often greater for small and mid-cap firms where investor surprise plays a larger role in valuation shifts.
When it comes to investor-focused metrics such as the price-to-earnings (P/E) ratio, firm size again influences interpretation. High P/E ratios in large firms are often justified by brand strength or market leadership (Chan, 2023). Conversely, the same multiple in a small firm may be questioned unless backed by a compelling growth narrative (Ben-David & Chinco, 2024). Empirical evidence from recent Indian studies suggests that market tolerance for valuation premiums is significantly higher in large firms, partly due to greater institutional ownership and analyst endorsement.
H3a: Firm size moderates the relationship between financial disclosures and abnormal stock returns, such that the effects are stronger for smaller firms.
Overall, firm size shapes how financial disclosures are contextualized and responded to by the market. It acts as a filter through which investors assess credibility, sustainability, and strategic intent. By incorporating firm size as a moderator, this study adds a crucial layer of insight into the heterogeneous effects of financial transparency across the corporate spectrum in India.
H3b: Firm size moderates the relationship between financial disclosures and firm value, such that the effects are stronger for smaller firms.
Conceptual Framework
The following is the conceptual framework developed for the study:
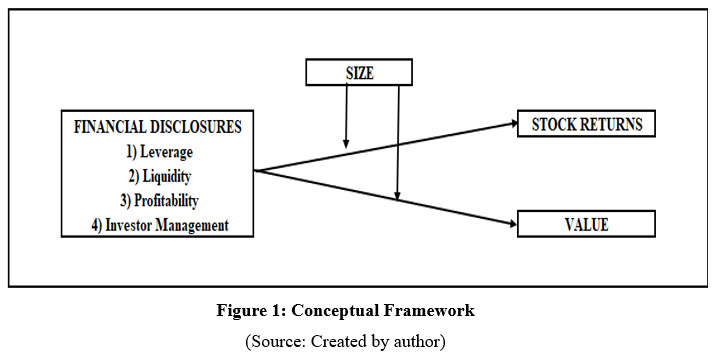 | Figure 1: Conceptual Framework
|
(Source: Created by author)
Chapter 3: Materials and Methods
Data and Sample
This study uses a panel dataset comprising 353 non-financial firms listed on the National Stock Exchange (NSE) of India over the period 2014 to 2024. Firm-level financial data were collected from the ProwessIQ database maintained by the Centre for Monitoring Indian Economy (CMIE), which offers detailed audited financial statements and corporate fundamentals. Stock price data and daily market returns were sourced from Yahoo Finance, which provides reliable market data required for calculating abnormal returns. The sample selection excluded financial firms due to their structurally different balance sheets and regulatory requirements. As per Ellili (2023), since the financial companies have a fundamentally different and regulated capital structures, there could be a distortion of the comparative analysis with the non-financial firms. It could also lead to heterogeneity which might undermine the findingsâ reliability across general corporate disclosures. Only firms with consistent annual disclosures for the selected financial variables and trading data were retained, resulting in an unbalanced panel. The 10-year timeframe 2014â2023 for explanatory variables and 2015â2024 for Tobinâs Q allows for both cross-sectional and longitudinal analysis of disclosure impact. The Indian context was chosen for its evolving regulatory environment, heterogeneity in firm size, and increasing investor reliance on financial disclosures, making it a compelling case for assessing how disclosure content and firm size influence both short-term and long-term firm performance.
Variables and Proxies
The dependent variables are as follows
Abnormal Stock Return (RETURN) is calculated as the percentage change in closing stock price on the trading day following the disclosure, adjusted for Nifty 50 market return. This measure captures investorsâ immediate reaction to financial announcements, isolating the effect of disclosed information. It reflects how quickly and efficiently the market incorporates new data into prices (Plastun et al., 2021), making it ideal for short-window event studies in emerging markets like India.
Value (TOBINS Q) is calculated as the ratio of a firmâs market value (market capitalization + total liabilities) to total assets. It serves as a proxy for long-term firm value and market expectations of future profitability (Jonnius & Marsudi, 2021). Tobinâs Q for year t+1 is regressed on financial data from year t to establish a forward-looking relationship and reduce simultaneity bias. A higher Tobinâs Q suggests stronger market valuation relative to asset base.
Furthermore, the explanatory variables are as follows
Leverage (Leverage) is measured by the Debt-to-Equity ratio and reflects the extent of a firmâs reliance on debt financing (Odhiambo et al., 2025). High leverage may increase financial risk and reduce firm value due to higher bankruptcy probability and agency costs. In the context of Tobinâs Q, excessive debt may constrain future investment flexibility, lowering market valuation. Conversely, optimal leverage may enhance value through tax advantages if appropriately managed.
Profitability (Profitability) is measured by Return on Equity (ROE), indicating a firmâs efficiency in generating returns on shareholdersâ equity. It is a key determinant of firm value and investor confidence (Desmon et al., 2022). High ROE signals operational effectiveness and earnings sustainability, both positively correlated with Tobinâs Q. Profitability contributes to higher market valuation by enhancing retained earnings and supporting long-term reinvestment strategies.
Liquidity (Liquidity) is proxied by the Cash Ratio, defined as cash and equivalents divided by current liabilities. It reflects a firmâs ability to meet short-term obligations (Lalithchandra & Rajendhiran, 2021). High liquidity typically enhances investor confidence and protects firm value during volatility. In the Tobinâs Q model, liquidity contributes to firm value by ensuring operational resilience and the capacity to exploit growth opportunities without immediate external financing.
Investor management (Investor) is proxied by the Price-to-Earnings (P/E) ratio, representing how the market values the firmâs earnings. A higher P/E reflects growth expectations, while a lower P/E may indicate undervaluation or risk (Sam, 2025). In relation to Tobinâs Q, the P/E ratio helps capture market sentiment and earnings-based valuation premiums. However, inflated P/E without strong fundamentals may signal speculative pricing and eventually reduce firm value.
Additionally, Firm Size (Size) is considered as the moderator. It is measured as the natural logarithm of total assets, capturing the scale and visibility of a firm (Felzensztein et al., 2022). Size moderates the relationship between financial disclosures and Tobinâs Q by influencing how disclosures are interpreted. Larger firms often benefit from greater market credibility and analyst coverage, which can amplify or dampen the valuation effects of financial metrics. The moderating effect tests for heterogeneity in disclosure valuation across firm sizes.
Lastly, the following are the control variables
Firm Age (AGE) is measured as the natural logarithm of the number of years since incorporation. Older firms may benefit from greater reputational capital, operational experience, and investor trust (Chakraborty et al., 2023), potentially affecting both stock returns and firm value.
Firm Growth (Growth) is proxied by the annual percentage change in revenue. Firms with high revenue growth are often perceived as dynamic and forward-looking (Goh et al., 2022), influencing market perception and valuation positively.
Year Effects (COVID) is the binary variable: 0 for fiscal years before 2020 and 1 for 2020 and beyond. This captures structural breaks due to the COVID-19 pandemicâs impact on firm performance, investor sentiment, and disclosure quality.
Industry Effects groups the companies by industry based on NSE classification. Categorical coding controls for industry-specific dynamics, competition intensity, and sectoral growth patterns, which can influence both market response and firm valuation.
Category Effects is Based on SEBIâs classification of companies into High, Medium, and Low disclosure categories. This accounts for inherent differences in disclosure quality and regulatory expectations, helping control for baseline variation in transparency across firms.
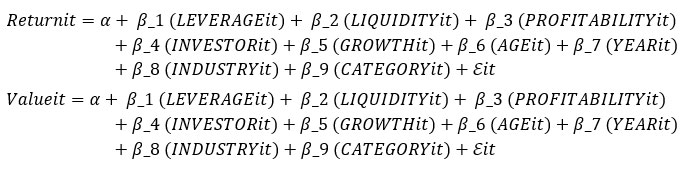
Econometric Models and Techniques
This study employs a panel data approach using fixed-effects regression models to assess the impact of financial disclosures on firm performance. Fixed effects are chosen to control for unobserved, time-invariant firm-specific heterogeneity that could bias the results, such as managerial quality or firm culture (Amir et al., 2016). Four models are estimated: (1) the effect of financial disclosures on next-day abnormal stock returns, (2) the effect on future firm value (Tobinâs Q), (3) the moderating effect of firm size on the disclosureâreturn relationship, and (4) the moderating effect on the disclosureâvalue relationship.
Benchmark Models (1 and 2)
Moderated Models (3 and 4)
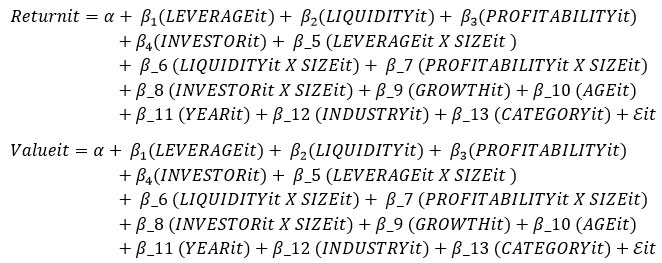
Interaction terms between firm size and each financial disclosure variable are included in Models 3 and 4 to capture moderation. All models include year, industry, and disclosure category fixed effects to control for macroeconomic trends, sector-specific factors, and regulatory disclosure regimes.
Descriptives
The descriptive statistics reveal considerable variation across the key variables. Tobinâs Q has a high standard deviation (255.14), indicating wide dispersion in firm valuation, likely due to industry and size differences. Leverage ranges from -111.08 to 387.34, suggesting some firms may report negative equity or extreme debt levels. Liquidity and profitability also show significant skewness, with negative profitability values pointing to loss-making firms. The mean return (0.14) confirms moderate next-day market reactions to disclosures. Investor management (P/E ratio) exhibits extreme variation (range: -61.89 to 601.75), highlighting diverse investor expectations. Firm size (log assets) is more normally distributed, with values between 9.54 and 30.50, supporting its use as a moderator. Overall, the data show meaningful variation across Indian firms, justifying further analysis.
Table 1: Descriptive Statistics
Variable | Obs | Mean | Std. Dev. | Min | Max |
TobinsQ | 3530 | 17.26 | 255.14 | 0.98 | 74.60 |
Leverage | 3530 | 1.51 | 9.32 | -111.08 | 387.34 |
Liquidity | 3530 | 0.10 | 0.28 | 0.01 | 9.82 |
Profitability | 3530 | 0.12 | 1.11 | -52.38 | 11.48 |
Investor Management | 3530 | 5.51 | 24.97 | -61.89 | 601.75 |
Return | 3530 | 0.14 | 0.23 | 0.00 | 0.90 |
Log_Size | 3530 | 24.97 | 1.66 | 9.54 | 30.50 |
Results
Correlation Analysis
The correlation matrix reveals generally low pairwise correlations, suggesting minimal multicollinearity among variables. Notably, profitability and leverage exhibit a moderately strong negative correlation (-0.5115), consistent with pecking order theory, where profitable firms rely less on debt (Yakubu et al., 2021). Return is positively correlated with investor management (0.2531) and control variables (0.4154), indicating that investor perceptions and firm-specific characteristics play a role in market reaction. Other correlations are weak, including Tobinâs Q with leverage (0.0017) and liquidity (-0.0152), implying that firm value is influenced by more complex interactions rather than bivariate relationships. The modest values across the matrix support the inclusion of all variables in the regression models without significant multicollinearity concerns.
Table 2: Correlation Analysis
TobinsQ | Leverage | Liquidity | Profitability | Investor | Return | |
TobinsQ | 1.0000 | |||||
Leverage | 0.0017 | 1.0000 | ||||
Liquidity | -0.0152 | -0.0284 | 1.0000 | |||
Profitability | -0.0055 | -0.5115 | -0.0017 | 1.0000 | ||
Investor | -0.0069 | 0.0006 | -0.0067 | 0.0083 | 1.0000 | |
Return | -0.0293 | 0.0319 | 0.0067 | -0.0021 | 0.2531 | 1.0000 |
Sustainability | 0.0588 | 0.0196 | 0.0218 | 0.0018 | -0.0399 | -0.0655 |
Control | 0.0678 | 0.0427 | 0.0333 | 0.0065 | 0.0744 | 0.4154 |
Panel Data Regression
Benchmark Models
Model 1 estimates the direct impact of financial disclosures on Tobinâs Q, a forward-looking measure of firm value. The results reveal that liquidity and profitability are positively and significantly associated with Tobinâs Q, while leverage and investor management (proxied by the P/E ratio) exhibit negative effects. Specifically, the positive coefficient on liquidity suggests that firms with higher cash ratios are viewed favourably by the market, likely due to their enhanced financial flexibility and reduced risk of insolvency. Profitability, measured via return on equity, also positively influences firm value, reflecting the marketâs appreciation for sustained earnings performance and efficient capital use. Conversely, the negative relationship between leverage and Tobinâs Q underscores the marketâs penalization of excessive debt. In the Indian context, where investor sensitivity to financial risk is pronounced, this finding aligns with expectations that high debt undermines perceived firm stability. Surprisingly, investor management has a negative effect on firm value. This could imply that a high P/E ratio, without clear earnings justification, may raise concerns about overvaluation. The modelâs R² of approximately 24.05% indicates a reasonable explanatory power for firm-level panel data. Overall, the results support the notion that not all disclosures are equally rewarded in the market, and that investor interpretation of financial metrics is selective and context dependent.
Model 2 examines how financial disclosures influence short-term market reactions, proxied by the 1-day abnormal return following disclosure. All four financial indicatorsâleverage, liquidity, profitability, and investor managementâare statistically significant. Liquidity and profitability have the strongest positive coefficients, suggesting that investors respond favourably to firms with high short-term solvency and strong earnings performance. This indicates that such disclosures immediately enhance investor confidence and trigger price adjustments. Interestingly, leverage exerts a negative effect, albeit smaller than in the Tobinâs Q model. This suggests that even in the short term, market participants discount high debt levels due to perceived financial risk. Conversely, investor management (P/E ratio) is positively associated with return, implying that investors initially interpret high valuation multiples as growth signals. This short-term optimism, however, contrasts with its negative association with Tobinâs Q in Model 1, pointing to a divergence between speculative sentiment and fundamental valuation. The R² of 20.85% suggests that financial disclosures explain a meaningful portion of the stock price movement (Table 3). In summary, while the market reacts quickly to disclosed metrics, the direction and strength of these reactions differ from those influencing long-term firm value, indicating that timing and context shape investor behaviour.
Table 3: Results of the Benchmark/Direct Models
Model 1 (Tobins Q) | Model 2 (Return) | |
R-squared | 0.2405** | 0.2085** |
Financial Disclosures | ||
Leverage | -9.9139** | -0.0048** |
Liquidity | 13.4839** | 1.3515*** |
Profitability | 55.6175** | 0.6681** |
Investor | -0.2443** | 0.0025** |
Controls | ||
Growth | -0.0055 | -0.0058 |
Age | 10.0757 | 9.4208 |
Category-effects | Included | Included |
Time-effects | Included | Included |
Industry-effects | Included | Included |
Note: (*), (**), (***) indicate significance at 10%, 5% and 1%, respectively.
Hypotheses H1a through H1d and H2a through H2d are partially supported. For stock returns (H1 series), all four variables are significant with expected signs, confirming the hypotheses. For firm value (H2 series), liquidity and profitability support H2b and H2c, while H2a and H2d (leverage and investor management) are supported with negative effects.
Moderated Models
Model 3 extends the moderation framework to firm value (Tobinâs Q), testing whether firm size influences the long-term valuation effects of financial disclosures. The results reveal mixed but theoretically consistent patterns. The interaction between liquidity and size remains positive, indicating that large firms are rewarded more in the long run for maintaining liquidity buffers. This suggests that institutional investors interpret such financial health signals more credibly in well-established firms. Meanwhile, the interaction between profitability and size is significantly negative, reinforcing the finding that profitability disclosures lose valuation impact in larger firmsâpossibly due to high expectations and limited growth potential. Notably, the leverage à size interaction is negative, suggesting that larger firms are penalized more harshly by the market for excessive debt. This contradicts common assumptions that big firms can better absorb leverage and may reflect investor concern over inefficient capital structuring in high-profile firms. The investor management à size interaction is weakly positive, indicating that large firms with high P/E ratios may still retain investor trust, though the effect is modest. Model 3âs R² improves to 0.3021 (Table 4), supporting the relevance of moderation in explaining firm value. Overall, size conditions how financial metrics are valued, especially in the long-term perspective.
Model 4 introduces interaction terms between firm size and each financial disclosure to assess whether firm size moderates the relationship between financial disclosures and abnormal stock returns. The interaction between liquidity and size is positive and statistically significant, indicating that larger firms benefit more from liquidity disclosures in the eyes of investors. This may reflect stronger trust in the financial prudence of large firms, whose cash reserves are interpreted as strategic assets rather than inefficiencies. Similarly, the interaction between investor management and size is slightly positive, implying that P/E ratios in larger firms are perceived more optimistically, possibly due to institutional backing and analyst coverage. In contrast, the interaction between profitability and size is negative, suggesting diminishing marginal stock return responses to profitability disclosures in large firms. This may be because profitability is already expected in large, mature firms, and thus has limited signalling value. Interestingly, the interaction between leverage and size is marginally positive, implying that the market penalizes leverage more in smaller firms. These findings reinforce the idea that disclosure effects are not uniform but depend on the structural characteristics of the firm. The modelâs R² of 0.2613 remains strong, and the inclusion of moderators adds important nuance to how investors perceive disclosure signals across firm sizes.
Table 4: Results of the Moderated Models
Model 1 (Tobins Q) | Model 2 (Return) | |
R-squared | 0.3021** | 0.2613** |
Financial Disclosures | ||
Leverage | -9.9139** | -0.0048** |
Liquidity | 13.4839** | 1.3515*** |
Profitability | 55.6175** | 0.6681** |
Investor | -0.2443** | 0.0025** |
Financial Disclosures (Moderated) | ||
Leverage X Size | -0.3947* | 0.0001* |
Liquidity X Size | 0.5785** | 0.0595** |
Profitability X Size | -2.2382** | -0.0262 |
Investor X Size | 0.0120* | 0.0001 |
Controls | ||
Growth | -0.0055 | -0.0058 |
Age | 10.0757 | 9.4208 |
Category-effects | Included | Included |
Time-effects | Included | Included |
Industry-effects | Included | Included |
Hypotheses H3a and H3b are supported. Firm size significantly moderates the relationship between financial disclosures and both stock returns and Tobinâs Q. The direction of moderation varies by metric: liquidity and investor management effects strengthen with size, while leverage and profitability show diminishing or negative effects. These results underscore the need to account for firm-specific context, particularly size, when interpreting the market impact of financial information.
Discussion
This study explored the impact of key financial disclosuresâleverage, liquidity, profitability, and investor managementâon short-term stock returns and long-term firm value (Tobinâs Q) in the context of Indian listed companies. Using fixed-effects panel regression models, the results revealed consistent patterns: liquidity and profitability positively influenced both stock returns and firm value, while leverage and investor management had mixed or negative effects (Table 3). The inclusion of firm size as a moderating factor further clarified these relationships, showing that the magnitude and direction of disclosure impact differ across small and large firms (Table 4). These findings broadly align with prior literature. For instance, the positive influence of liquidity is consistent with past studies which emphasized the role of solvency in enhancing investor confidence in emerging markets (Ndruru, 2025; Chouaibi et al., 2022). Similarly, the strong positive effect of profitability echoes the past evidence where profitability served as a reliable indicator of long-term value creation (Mysaka & Derun, 2021). The negative relationship between leverage and performance supports earlier findings, indicating that excessive debt introduces financial distress costs (Akhtar et al., 2022), especially in less diversified firms. However, the results diverge from traditional assumptions regarding the P/E ratio. While investor management (P/E) positively influenced stock returns in the short term, it negatively affected firm value. This suggests speculative overvaluation or unjustified optimism (Stephans, 2021), particularly in smaller firms, which eventually corrects in long-term valuation (de Alencar Vilela, 2024). This nuanced finding challenges the assumption that P/E ratios are uniformly value-enhancing. Furthermore, the moderation analysis provided fresh insights. Profitability and leverage had a diminishing effect on performance in larger firms, contradicting expectations that scale always enhances disclosure impact. On the other hand, liquidityâs effect strengthened with size, confirming that financial strength in large firms is perceived more credibly. These findings contribute to the growing literature by highlighting the heterogeneous effects of disclosures and reinforcing the importance of contextual variables such as firm size in emerging market environments like India.
Conclusion
Summary
The findings offer robust support for signalling theory. Liquidity and profitability served as effective signals of financial strength, prompting favourable reactions in both stock prices and firm value. These disclosures reduce uncertainty and reinforce investor trust, especially in a market like India, where formal analyst coverage is limited for smaller firms. The fact that these signals were more powerful for large firms suggests that credibility enhances the signalling effectâconsistent the theory. However, the negative impact of leverage and P/E on firm value shows that not all signals are interpreted positively, reinforcing the notion that signalling effectiveness depends on context and perception. Hence, the study supports signalling theory but extends it by showing its conditional nature.
Agency theory posits that financial disclosures help align managerial actions with shareholder interests by reducing information asymmetry. This study supports that view, particularly through the positive role of liquidity and profitability disclosures in enhancing firm performance. These metrics likely reassure investors that management is acting in the firmâs long-term interest. The negative impact of leverage on both returns and value reinforces concerns over agency costs of debt, as high leverage may incentivize risk-shifting or signal weak governance. Interestingly, the moderation findings show that agency problems may intensify in larger firms, where complexity and dispersed ownership dilute oversight. Thus, while the core tenets of agency theory are affirmed, the evidence suggests that agency costs and disclosure efficacy are not uniformly distributed, varying significantly with firm characteristics like size.
Practical Implications
The study presents several implications for corporate managers, investors, and regulators. First, firms should recognize that not all financial disclosures are interpreted equally; liquidity and profitability carry stronger positive signals, especially for larger firms. Managers should strategically highlight these metrics in investor communications, especially when targeting institutional investors. Second, leverage remains a red flag across firm sizes, suggesting that firms should aim for optimal capital structures and communicate debt usage transparently. Third, the findings imply that firms cannot rely on valuation multiples like P/E alone to boost investor sentiment, particularly in the absence of strong earnings. For investors, the results stress the importance of interpreting disclosures through the lens of firm size and context. Regulators and policymakers can also use these insights to enhance disclosure frameworks by encouraging standardized, size-sensitive reporting formats that reduce ambiguity and improve market interpretation of firm performance.
Limitations and Future Scope
Despite its robust methodology, the study has several limitations. First, the analysis is limited to listed firms on the NSE, which may exclude important dynamics in smaller, unlisted or SME segments where disclosure practices and investor reactions could differ. Second, while firm size is considered as a moderator, other firm characteristicsâsuch as ownership structure, institutional shareholding, or governance qualityâmay also shape the interpretation of financial disclosures but were not included in this study. Third, the use of annual report release dates may not perfectly capture when information was first absorbed by the market, potentially affecting the precision of abnormal return calculations. Moreover, the Tobins Q as a proxy for market value might not capture the complete idea of firm valuation while there could also be omitted variable bias, possibly due to elimination of factors which could influence the relationship between disclosures and market outcomes.
Future research could address these limitations by expanding the sample to include other stock exchanges (e.g., BSE), incorporating additional moderators, or using high-frequency intraday data for more accurate event analysis. Sectoral analysis may also yield deeper insights, as investor interpretation of leverage or profitability could vary by industry. Additionally, qualitative analysis of disclosure tone and languageâbeyond numeric ratiosâcould offer richer understanding of signalling dynamics in corporate communications. The future researchers could use other proxies for valuation such as Market-Book value, to capture nuanced aspects. Additionally, to address the omitted variable bias, the future researchers could use more control variables such as board characteristics, ownership structure, and R&D intensity which are key determinants of disclosures. Finally, replicating this study in other emerging economies would allow for cross-market comparison, helping identify which effects are country-specific and which are more generalizable.
Acknowledgement
We would like to thank St. Xaviers University and Xavier Business school for allowing us to provide the relevant resources and access to databases in the library.
Funding Sources
The authors received no financial support for the research, authorship, and/or publication of this article.
Conflict of Interest
The authors do not have any conflict of interest.
Data Availability Statement
The data has been incorporated in the manuscript in the form of empirical results.
Ethics Statement
This research did not involve human participants, animal subjects, or any material that requires ethical approval.
Informed Consent Statement
This study did not involve human participants, and therefore, informed consent was not required.
Permission to reproduce material from other sources
All the tables have been made by the author and are not a part of any other work.
Author Contributions
Rohit Singh: Methodology, Data Collection, Analysis, Writing of the Final draft.
Sitangshu Khatua: Conceptualization, Introduction, Literature, Proofreading.
References
- Aflatooni, A., Karimi, J., & Khatiri, M. (2022). Access to external financial resources, bargaining power, and speed of working capital adjustment. Journal of Accounting Knowledge, 13(3), 45-63.
- Agyei-Mensah, B. K. (2015). The determinants of financial ratio disclosures and quality: Evidence from an emerging market. International Journal of Accounting and Financial Reporting, 5(1).
CrossRef - Ahmad, N., Shah, F. N., Ijaz, F., & Ghouri, M. N. (2023). Corporate income tax, asset turnover and Tobinâs Q as firm performance in Pakistan: Moderating role of liquidity ratio. Cogent Business & Management, 10(1), 2167287.
CrossRef - Akbar, A., Akbar, M., Nazir, M., Poulova, P., & Ray, S. (2021). Does working capital management influence operating and market risk of firms?. Risks, 9(11), 201.
CrossRef - Akhtar, M., Yusheng, K., Haris, M., Ain, Q. U., & Javaid, H. M. (2022). Impact of financial leverage on sustainable growth, market performance, and profitability. Economic Change and Restructuring, 1-38.
CrossRef - Akhtar, T. (2025). Cash holdings in MENA region: evidence from trade-off model, pecking order theory, and agency theory. Future Business Journal, 11(1), 1-18.
CrossRef - Al Janabi, M. A. (2024). Unlocking the Microstructure of Liquidity Risk: Understanding Interactions with Other Financial Risks and Best Practices in Oversight and Governance. In Liquidity Dynamics and Risk Modeling (pp. 79-167). Palgrave Macmillan, Cham.
CrossRef - Ambadapudi, H., & Matai, R. (2024). Benefits of a collaborative liquidity management approach: a simulation study for the Indian auto value chain. Journal of Modelling in Management, 19(6), 1795-1826.
CrossRef - Amir, E., Carabias, J. M., Jona, J., & Livne, G. (2016). Fixed-effects in empirical accounting research. Available at SSRN 2634089.
CrossRef - Anoop, M. R. (2024). Cash is King: The Strategic Importance of Liquidity in Financial Management-a review. Multidisciplinary Research in Arts, Science & Commerce (Volume-7), 26.
- Asri, M. (2024). The Effect of Accounting Earnings and Company Size on Abnormal Stock Returns in Food and Beverage Sub-Sector Manufacturing Companies. Atestasi: Jurnal Ilmiah Akuntansi, 7(1), 687-703.
CrossRef - Azarberahman, A., Pakdelan, S., & Tohidinia, M. (2023). Accounting similarities, sophisticated investors, relevance and information asymmetry. International Journal of Applied Economics, Finance and Accounting, 17(1), 186-201.
CrossRef - A. (2024). Expected EPSÃ Trailing P/E (No. w32942). National Bureau of Economic Research.
CrossRef - Bhattacharya, A., Morgan, N. A., & Rego, L. L. (2022). Examining why and when market share drives firm profit. Journal of Marketing, 86(4), 73-94.
CrossRef - Blessing, H., & Sakouvogui, G. (2023). Impact of liquidity and solvency ratios on financial performance: a comprehensive analysis. Indonesia Auditing Research Journal, 12(3), 102-115.
- Chakraborty, D., Gupta, N., Mahakud, J., & Tiwari, M. K. (2023). Corporate governance and investment decisions of retail investors in equity: do group affiliation and firm age matter?. Managerial Auditing Journal, 38(1), 1-34.
CrossRef - Chan, L. H. (2023). Why the High Values for the CAPE Ratio in Recent Years Might Be Justified. Journal of Risk and Financial Management, 16(9), 410.
CrossRef - Chen, Z., Strebulaev, I. A., Xing, Y., & Zhang, X. (2021). Strategic risk shifting and the idiosyncratic volatility puzzle: An empirical investigation. Management Science, 67(5), 2751-2772.
CrossRef - Chouaibi, Y., Belhouchet, S., Chouaibi, S., & Chouaibi, J. (2022). The integrated reporting quality, cost of equity and financial performance in Islamic banks. Journal of Global Responsibility, 13(4), 450-471.
CrossRef - Cong, H. Li, D., Li, X., Xie, Y., & Yuan, C. (2024). Do Unexpected Earnings of Industry Leaders Affect the Discretionary Reporting Behavior of Followers? Evidence From China. Journal of Business Finance & Accounting.
CrossRef - de Alencar Vilela, C. (2024). Machine Learning-Driven P/E Ratios: Leveraging Equity Valuation in the Financial Sector.
- Desmon, A. R. W. A., & Meirinaldi, Y. C. (2022). The Effect of Return on Asset, Return on Equity and Debt to Equity Ratio on the Value of the Manufacturing Firm Listed on Stock Exchange 2015-2019. In MIC 2021: Proceedings of the First Multidiscipline International Conference, MIC 2021, October 30 2021, Jakarta, Indonesia (Vol. 196). European Alliance for Innovation.
CrossRef - Dickler, T. A., Folta, T. B., Giarratana, M. S., & Santalo, J. (2022). The value of flexibility in multi?business firms. Strategic Management Journal, 43(12), 2602-2628.
CrossRef - Ellili, N. O. D. (2023). Impact of corporate governance on environmental, social, and governance disclosure: Any difference between financial and non?financial companies?. Corporate Social Responsibility and Environmental Management, 30(2), 858-873.
CrossRef - Felzensztein, C., Saridakis, G., Idris, B., & Elizondo, G. P. (2022). Do economic freedom, business experience, and firm size affect internationalization speed? Evidence from small firms in Chile, Colombia, and Peru. Journal of International Entrepreneurship, 20(1), 115-156.
CrossRef - Gernsheimer, O., Gast, J., & Kanbach, D. K. (2024). Always on par? How small-and medium-sized enterprises manage coopetition strategies to innovate with large firms. International Small Business Journal, 42(7), 863-900.
CrossRef - Glova, J., & Panko, M. (2025). The Effects of Environmental, Social, and Governance Factors on Financial Performance and Market Valuation in the European Automotive Industry. International Journal of Financial Studies, 13(2), 82.
CrossRef - Goh, T. S., Henry, H., Erika, E., & Albert, A. (2022). Sales growth and firm size impact on firm value with ROA as a moderating variable. MIX: Jurnal Ilmiah Manajemen, 12(1), 99-116.
CrossRef - Gurani, H. (2023). Predicting Stock Performance in Indian Mid-Cap and Small-Cap Firms: An Exploration of Financial Ratios Through Logistic Regression Analysis. CECCAR Business Review, 4(9), 56-63.
CrossRef - Gwala, R. S., & Mashau, P. (2023). Tracing the evolution of agency theory in corporate governance. In Governance as a catalyst for public sector sustainability (pp. 260-285). IGI Global.
CrossRef - Hao, Y., & Li, S. (2021). Does firm visibility matter to debtholders? Evidence from credit ratings. Advances in Accounting, 52, 100515.
CrossRef - ICLG. (2024). Corporate Governance Laws and Regulations India 2024-2025. Retrieved from https://iclg.com/practice-areas/corporate-governance-laws-and-regulations/india
- Indrayono, Y. (2021). What Factors Affect Stocksâ Abnormal Return during the COVID-19 Pandemic: Data from the Indonesia Stock Exchange: Data from the Indonesia Stock Exchange. European Journal of Business and Management Research, 6(6), 1-11.
CrossRef - Ishaq, M., Islam, Y., & Ghouse, G. (2021). Tobinâs Q as an indicator of firm performance: Empirical evidence from manufacturing sector firms of Pakistan. International Journal of Economics and Business Administration, IX, 1, 425-441.
CrossRef - Jan, A. A., Lai, F. W., Draz, M. U., Tahir, M., Ali, S. E. A., Zahid, M., & Shad, M. K. (2021). Integrating sustainability practices into islamic corporate governance for sustainable firm performance: from the lens of agency and stakeholder theories. Quality & Quantity, 1-24.
CrossRef - Jonnius, J., & Marsudi, A. S. (2021). Profitability and the firmâs value. Dinasti International Journal of Management Science, 3(1), 23-47.
CrossRef - Khan, K. I., Qadeer, F., Mata, M. N., Chavaglia Neto, J., Sabir, Q. U. A., Martins, J. N., & Filipe, J. A. (2021). Core predictors of debt specialization: A new insight to optimal capital structure. Mathematics, 9(9), 975.
CrossRef - Kruk, S. (2021). Impact of capital structure on corporate valueâreview of literature. Journal of Risk and Financial Management, 14(4), 155.
CrossRef - Lalithchandra, B. N., & Rajendhiran, N. (2021). Liquidity ratio: an important financial metrics. Turkish Journal of Computer and Mathematics Education (TURCOMAT), 12(2), 1113-1114.
CrossRef - Li, X., & Hou, K. (2024). Investors' opinion disagreement and abnormal trading around pre-earnings announcements. International Review of Financial Analysis, 91, 103035.
CrossRef - Liu, Z., Du, Y., & Pennings, E. (2024). Open knowledge disclosure and firm value: a signalling theory perspective. Industry and Innovation, 31(4), 475-500.
CrossRef - Martins, O. S., & de Campos Barros, L. A. B. (2021). Firm informativeness, information environment, and accounting quality in emerging countries. The International Journal of Accounting, 56(01), 2150004.
CrossRef - Mesioye, O., & Bakare, I. A. (2024). Evaluating financial reporting quality: Metrics, challenges, and impact on decision-making. Int J Res Public Rev, 5(10), 1144-1156.
CrossRef - Michalkova, L., Stehel, V., Nica, E., & Durana, P. (2021). Corporate management: capital structure and tax shields. Marketing i menedžment innovacij, (3), 276-295.
- Mousa, A. L. I., Hassan, N. L., & Pirzada, K. (2022). Board governance mechanisms and liquidity creation: A theoretical framework. GATR Journal of Finance and Banking Review, 7(2), 122-134.
CrossRef - Munir, Q., Akram, B., & Abbas, S. A. (2024). Understanding Stock Price Dynamics with Dividend-Related Metrics and Financial Indicators in Pakistan's Non-Financial Sectors. Journal of Business and Economic Options, 7(1), 1-9.
- Mysaka, H., & Derun, I. (2021). Corporate financial performance and Tobinâs Q in dividend and growth investing. Contemporary Economics, 276-288.
CrossRef - Ndruru, F. (2025). The Role of Liquidity Management in Enhancing Corporate Financial Stability: a Systematic Literature Review on Cash Reserves and Marketable Securities Strategies. PRODUCTIVITY: Journal of Integrated Business, Management, and Accounting Research, 2(1), 09-17.
- Odhiambo, J. D., Murori, C. K., & Aringo, C. E. (2025). Financial Leverage and Firm Performance: An Empirical Review and Analysis. East African Finance Journal, 4(1), 25-35.
CrossRef - Odhoj, M. A., & Kariuki, P. (2024). TURNAROUND STRATEGIES AND PERFORMANCE OF INSURANCE FIRMS IN NAIROBI CITY COUNTY, KENYA. International Journal of Social Sciences Management and Entrepreneurship (IJSSME), 8(2).
- Orabi Awad, E., & Mohamed Ali, S. (2022). Non-linear relationship between capital structure and firm value nexus: an empirical study in Egyptian capital market.
CrossRef - Park, S. (2021). The P/E ratio, the business cycle, and timing the stock market. Journal of Portfolio Management, 47(8), 165-183.
CrossRef - Plastun, A., Sibande, X., Gupta, R., & Wohar, M. E. (2021). Evolution of price effects after one-day abnormal returns in the US stock market. The North American Journal of Economics and Finance, 57, 101405.
CrossRef - Platt, A. I. (2022). Beyond" Market Transparency": Investor Disclosure and Corporate Governance. Stan. L. Rev., 74, 1393.
- Salehi, M., Ammar Ajel, R., & Zimon, G. (2023). The relationship between corporate governance and financial reporting transparency. Journal of Financial Reporting and Accounting, 21(5), 1049-1072.
CrossRef - Sam, R. (2025). How to Adjust the P/E Ratio for Earnings Growth in Equity Valuation: PEG or PPP?. E Ratio for Earnings Growth in Equity Valuation: PEG or PPP.
CrossRef - Santos, T., & Veronesi, P. (2022). Leverage. Journal of Financial Economics, 145(2), 362-386.
CrossRef - Sardo, F., Serrasqueiro, Z., Vieira, E., & Armada, M. R. (2022). Is financial distress risk important for manufacturing SMEs to rebalance the short-term debt ratio?. The Journal of Risk Finance, 23(5), 516-534.
CrossRef - Schreck, P., & Raithel, S. (2018). Corporate social performance, firm size, and organizational visibility: Distinct and joint effects on voluntary sustainability reporting. Business & Society, 57(4), 742-778.
CrossRef - Serrasqueiro, Z., Sardo, F., Neves, E., & Morais, F. (2025). SME rebalancing short-term and long-term debt ratios: the role of financial distress costs. International Journal of Accounting & Information Management, 33(1), 169-186.
CrossRef - Sidiq, A. R., Sumirat, E., & Soekarno, S. (2024). Valuation, Financial Performance, and Macroeconomic Condition on Stock Return of Manufacture Companies.
- Spence, M. (1973). Job Market Signaling. The Quarterly Journal of Economics, 87(3), 355-374.
CrossRef - Stephans, M. K. (2021). The effects of the unexpected cautionary and annual earnings announcements on the Price Formation Process: evidence from the JSE.
- Tron, A., Franceschi, L. F., Colantoni, F., & Paolone, F. (2025). ESG Dynamics: Assessing the Link Between Sustainability Practices and the Cost of Capital. Corporate Social Responsibility and Environmental Management.
CrossRef - Vickneswaran, A. (2025). Corporate Governance, Management-Shareholder, and Reporting Practices: Navigating Transparency, Accountability, and Sustainable Decision-Making. In Governance Strategies for Effective Sustainable Development (pp. 1-14). IGI Global.
CrossRef - Yahaya, O. A. (2025). Institutional ownership and firm performance. Available at SSRN 5216573.
CrossRef - Yakubu, I. N., Kapusuzoglu, A., & Ceylan, N. B. (2021). Trade-off theory versus pecking order theory: The determinants of capital structure decisions for the Ghanaian listed firms. In Strategic outlook in business and finance innovation: Multidimensional policies for emerging economies (pp. 111-122). Emerald Publishing Limited.
CrossRef - Zajontz, T. (2022). Debt, distress, dispossession: towards a critical political economy of Africaâs financial dependency. Review of African Political Economy, 49(171), 173-183.
CrossRef - Zeidan, R. (2025). Financial Statements, Banksâ Operations, and Systemic Risk. In The Green Banking Transition Manual: Navigating the Sustainable Finance Landscape (pp. 7-123). Singapore: Springer Nature Singapore.
CrossRef - Zhang, R., Chu, T., Noronha, C., & Guan, J. (2022). Corporate value creation, stock price synchronicity and firm value in China: implications for beyond. Journal of Accounting in Emerging Economies, 12(3), 566-588.
CrossRef - Zhao, L., Mollica, V., Shen, Y., & Liang, Q. (2024). Liquidity, informational efficiency and firm default risk: a systematic literature review. Journal of Accounting Literature, 46(3), 321-342.
CrossRef

This work is licensed under a Creative Commons Attribution 4.0 International License.


